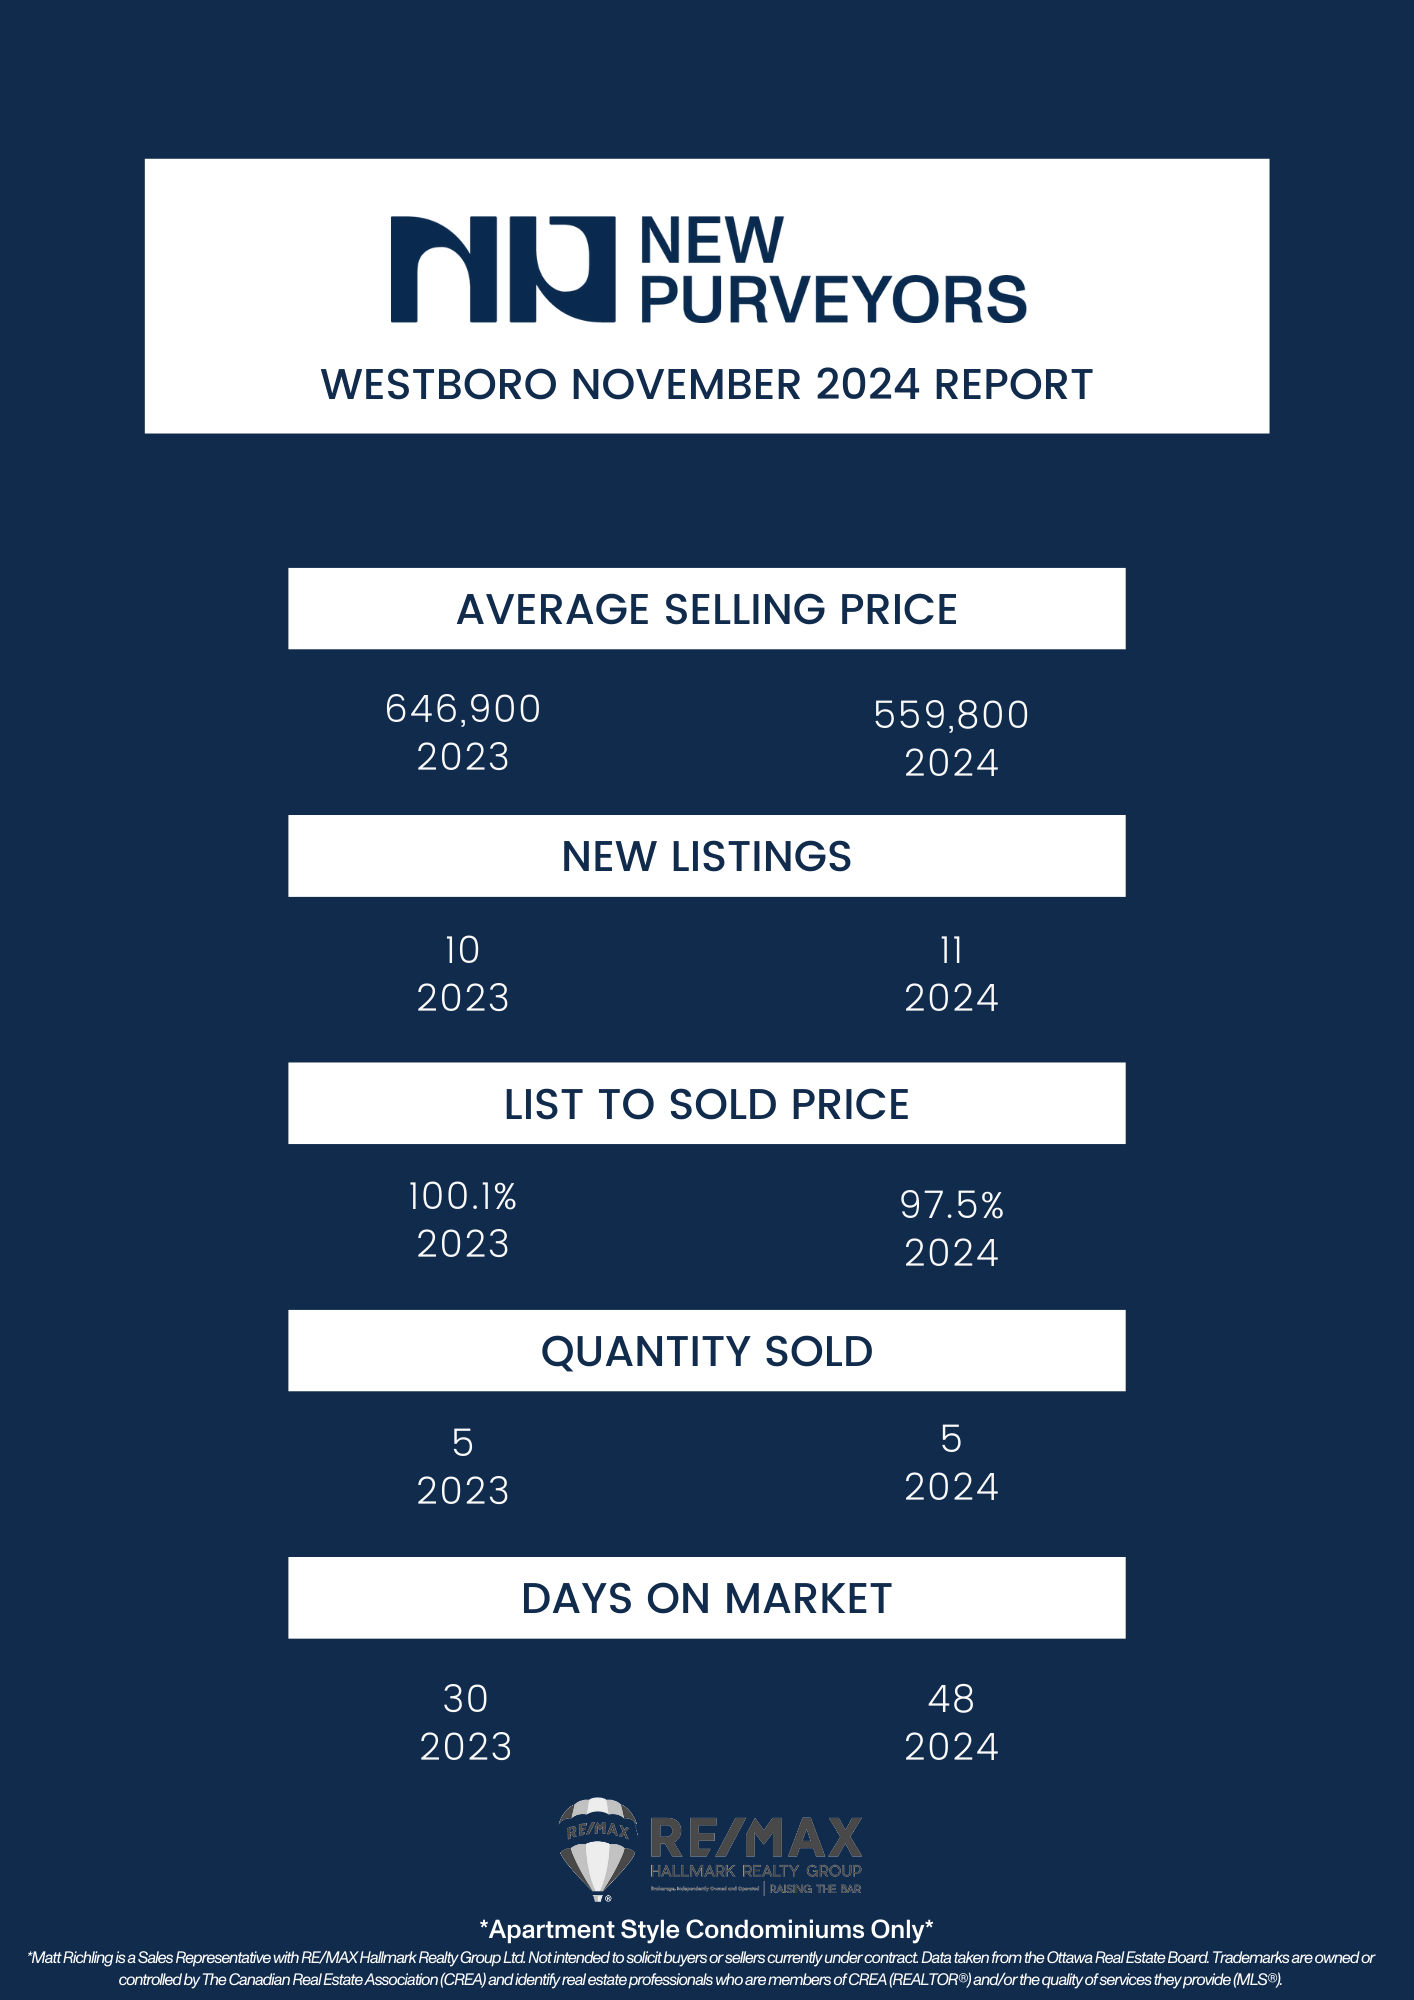
Every month we take a closer look and drill down the sales data of Ottawa condos from the previous month. Here are the statistics for June 2026 in the top five "downtown" areas - Centretown, Byward Market and Sandy Hill, Little Italy (which includes Lebreton Flats), Hintonburg, and Westboro. The information will be specific to apartment-style condominiums, and only what is sold through the MLS. Also important to note that DOM (Day's On Market) is calculated to include the conditional period, which in Ottawa is roughly 14 days for almost every single transaction.
Ottawa Housing Market Remains Balanced as Inventory Gives Buyers More Choice
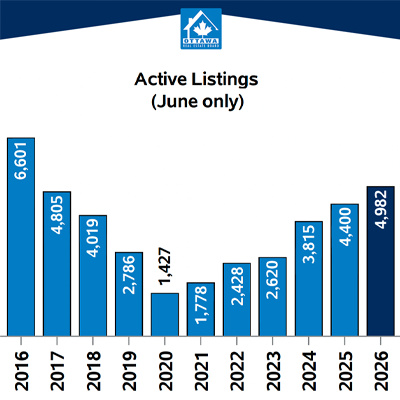
The Ottawa real estate market remained balanced in June 2026, with more homes available for sale and a slower early-summer pace compared with last year. While sales activity softened slightly, Ottawa home prices remained relatively stable overall, with important differences emerging between detached homes, townhomes and condos.
For buyers, higher inventory means more selection and more time to compare properties. For sellers, the market still supports strong results when a home is priced accurately, marketed well and positioned properly against nearby competition.
The key theme in the Ottawa housing market is not simply that inventory is rising. It is how well buyers continue to absorb that supply across different neighbourhoods and property types.
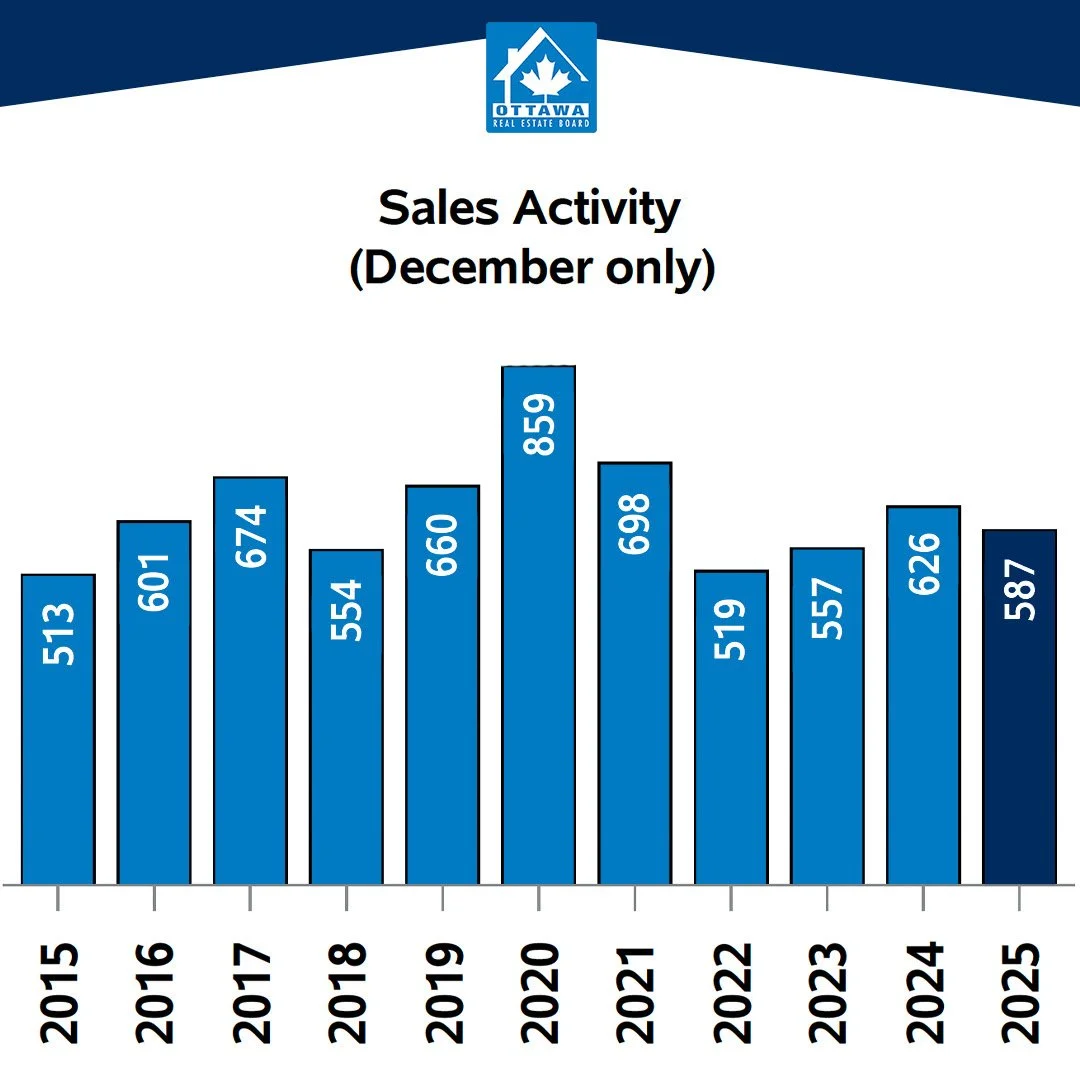
Ottawa Real Estate Sales in June 2026
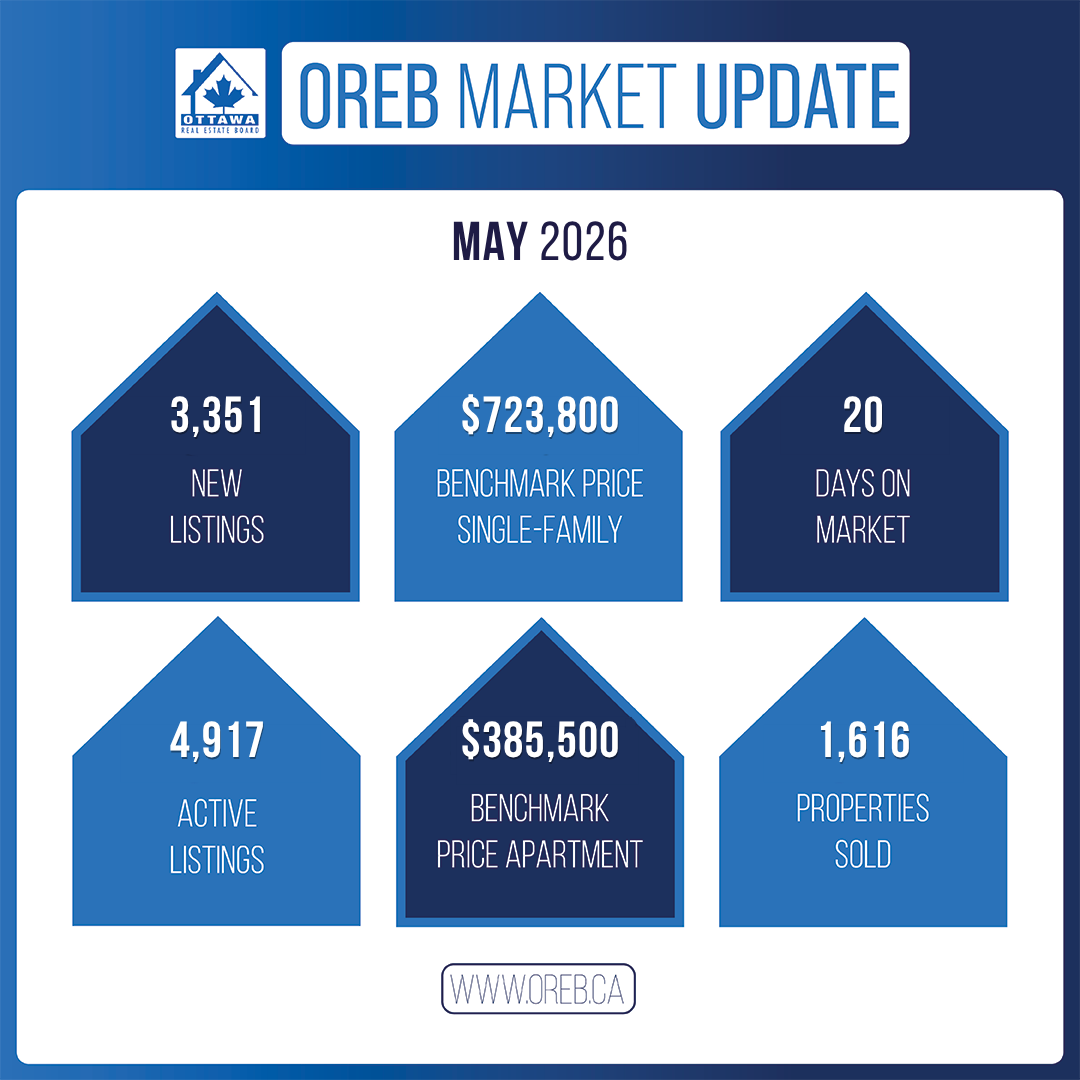
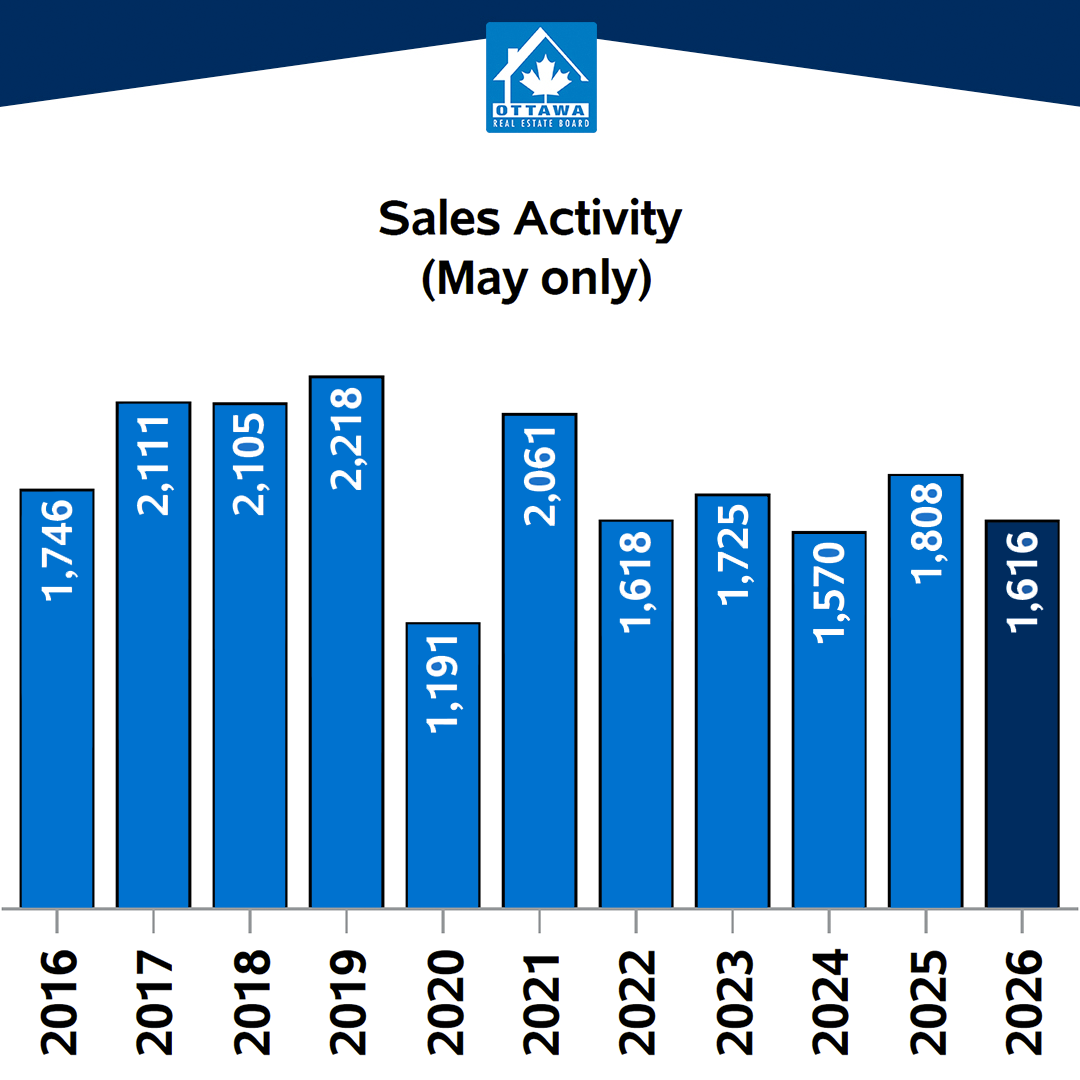
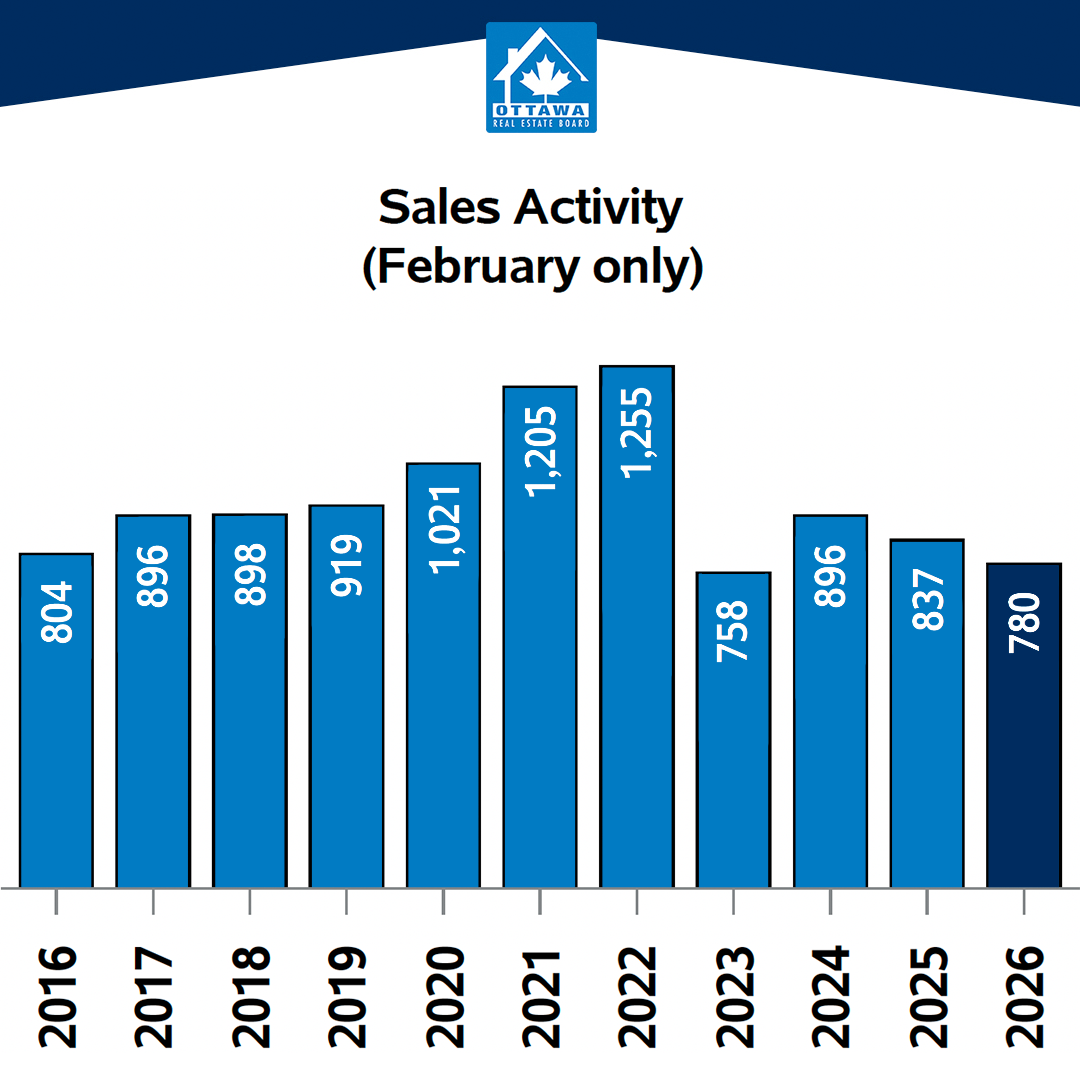
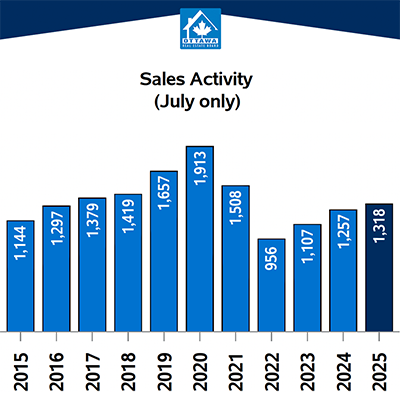
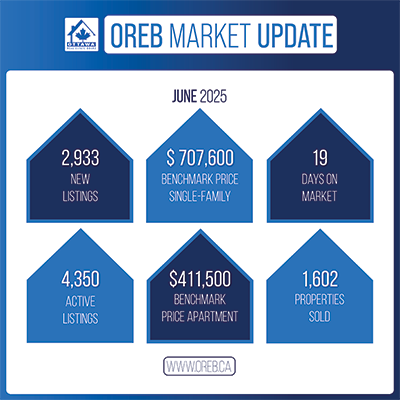
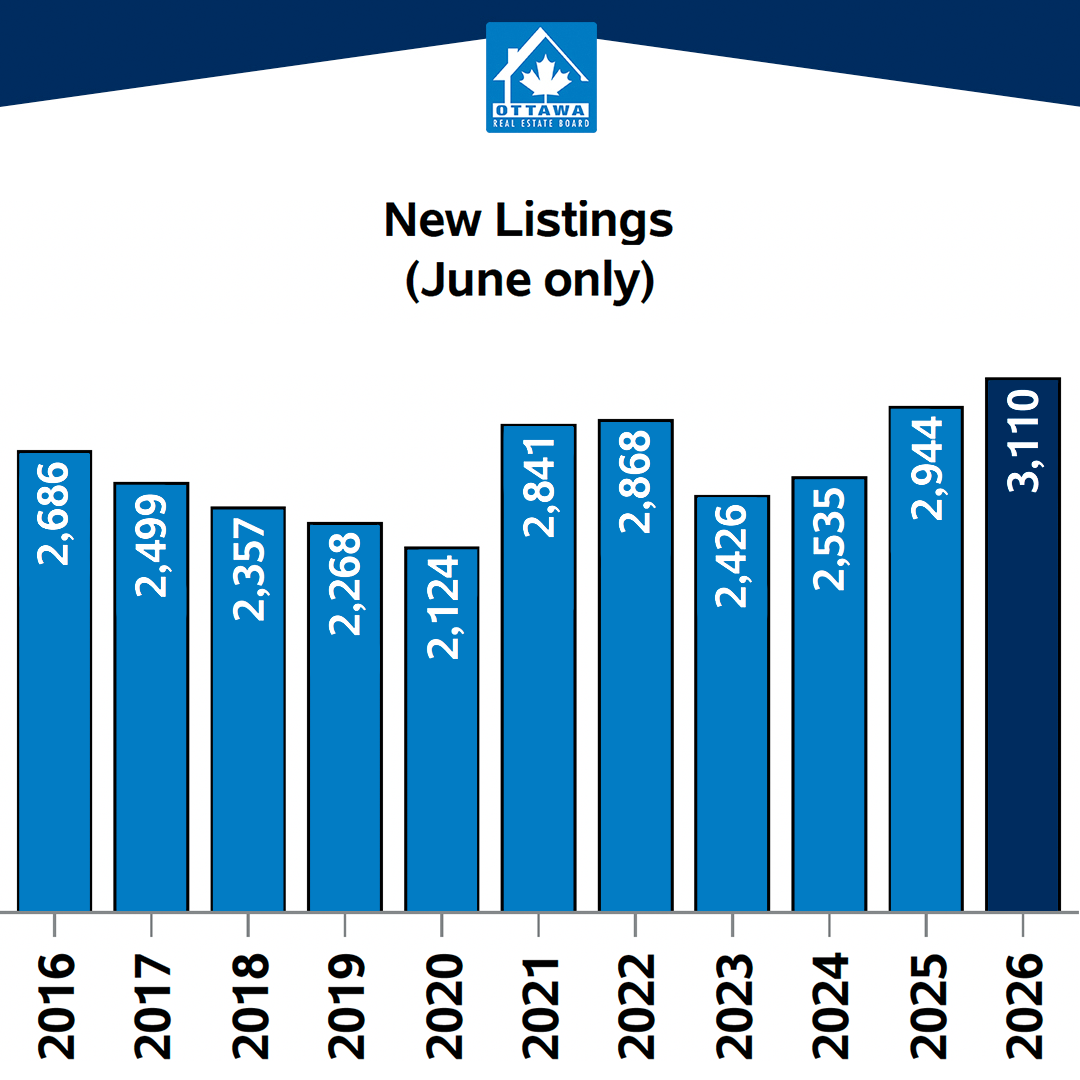
A total of 1,518 homes sold through the Ottawa MLS® System in June 2026. That was a 4.9 per cent decrease from June 2025 and down from 1,616 sales in May.
This seasonal slowdown is typical as Ottawa moves from the busy spring market into summer. However, year-to-date sales also remain below last year’s pace.
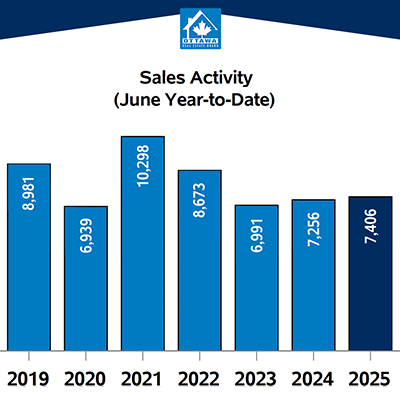
From January through June 2026, 6,969 homes sold in Ottawa, down 6.1 per cent from the same period in 2025. Total Ottawa real estate sales volume reached approximately $4.9 billion, a 6.2 per cent decrease year over year.
Ottawa Home Prices in June 2026
The average residential sale price in Ottawa was $733,648 in June 2026, up 1.3 per cent from June 2025.
The median sale price was $655,000, down 1.3 per cent year over year.
These two figures tell a slightly different story because the types of homes sold each month can affect the average price. A larger share of high-value detached home sales, for example, can raise the average even if broader market conditions are steady.
The MLS® Home Price Index, which helps account for changes in the mix of homes sold, showed a composite benchmark price decline of 1.3 per cent year over year. This points to a market that is generally stable, but with more pricing pressure in certain property types.
Detached Homes Remain Ottawa’s Most Stable Market Segment
Single-family homes continued to make up the largest share of Ottawa real estate sales in June, with 879 detached homes sold. Sales were down only 1.8 per cent from June 2025, making detached homes the most stable major property category.
Detached homes also had 2.8 months of inventory, which remained below the citywide average. This indicates that demand for family homes in Ottawa continues to absorb available listings at a relatively steady pace.
For homeowners considering selling a detached home in Ottawa, local pricing remains especially important. Conditions can differ significantly between neighbourhoods, school districts, lot sizes and home styles.
Ottawa Townhome Market Shows More Inventory and Pricing Pressure
Ottawa townhome sales totalled 429 in June, down 7.3 per cent from the same month last year.
Townhome inventory has continued to increase, with active listings up 27.6 per cent year over year. Months of inventory reached 3.2, suggesting buyers have more options than they did last year.
The benchmark price for Ottawa townhomes was down 3.9 per cent year over year. This does not mean every townhome is declining in value at the same rate, but it does show that townhome sellers are facing more competition in many parts of the city.
Well-presented townhomes in desirable Ottawa neighbourhoods can still attract strong interest, particularly when they are priced in line with current comparable sales rather than older market expectations.
Ottawa Condo Market Remains the Softest Segment
Apartment-style properties, including Ottawa condos, remained the softest part of the market in June 2026.
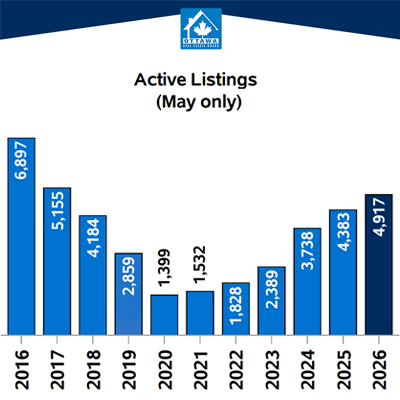
There were 178 apartment-style home sales, down 14.0 per cent from June 2025. Condo inventory reached 5.3 months, the highest level among the major property types, while benchmark condo pricing was down 6.0 per cent year over year.
This creates more opportunity for Ottawa condo buyers, especially those looking for first homes, downsizing options or investment properties. Buyers may have more negotiating room, more units to compare and less pressure to make immediate decisions.
For condo sellers, accurate pricing, professional presentation and a clear understanding of competing listings are increasingly important. Buildings with stronger locations, well-managed amenities, lower fees or updated suites may perform differently than the broader condo market.
Is Ottawa a Buyer’s Market or Seller’s Market?
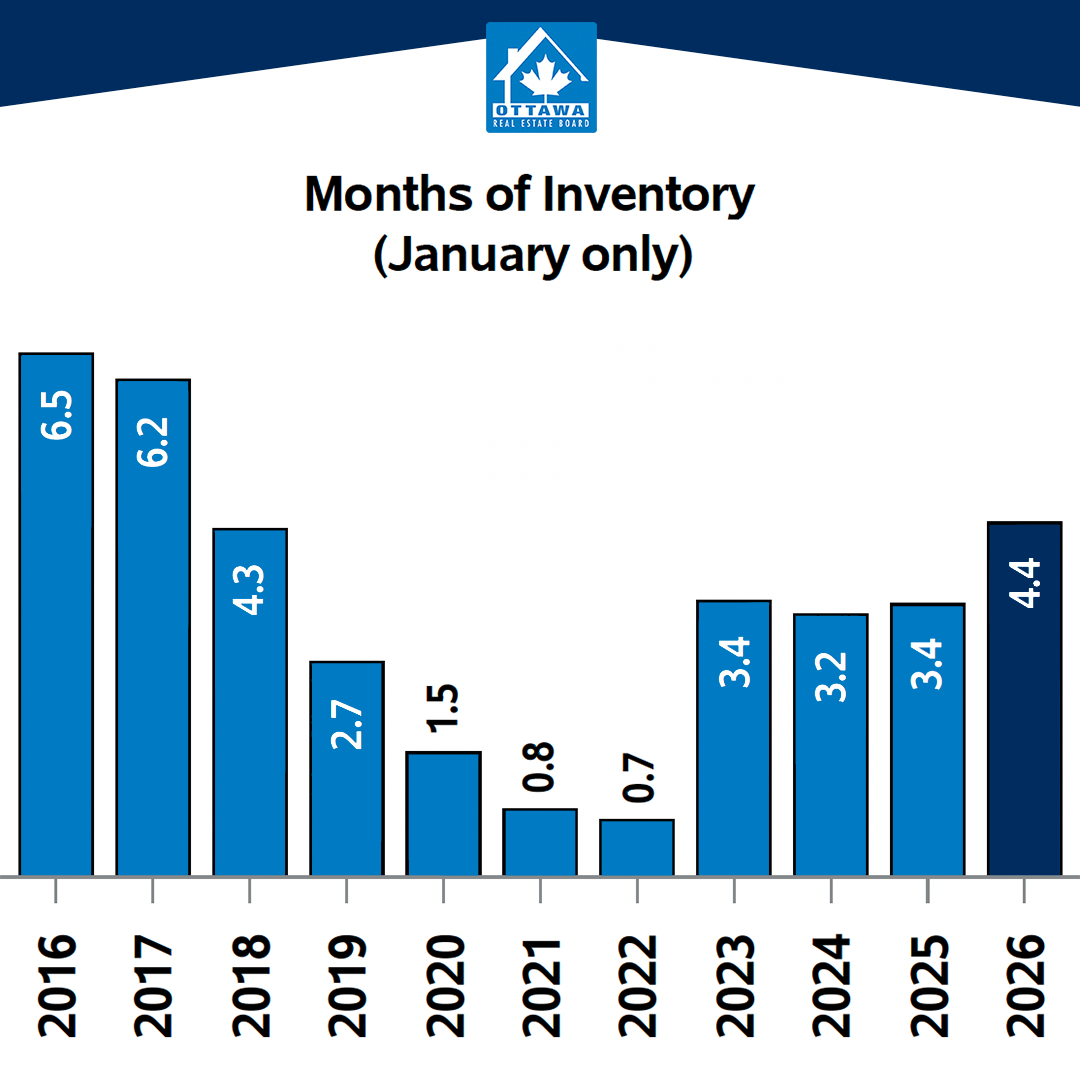
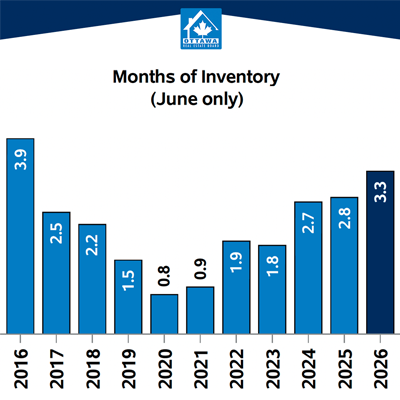
Ottawa remained in balanced market territory in June 2026.
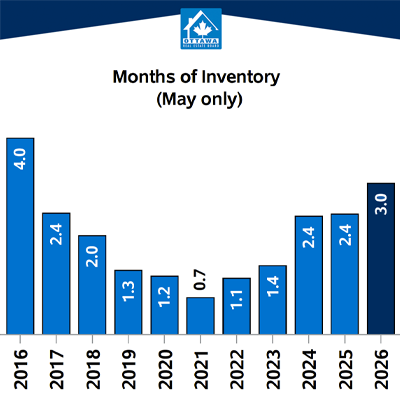
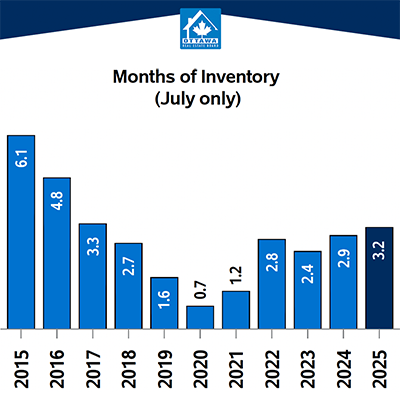
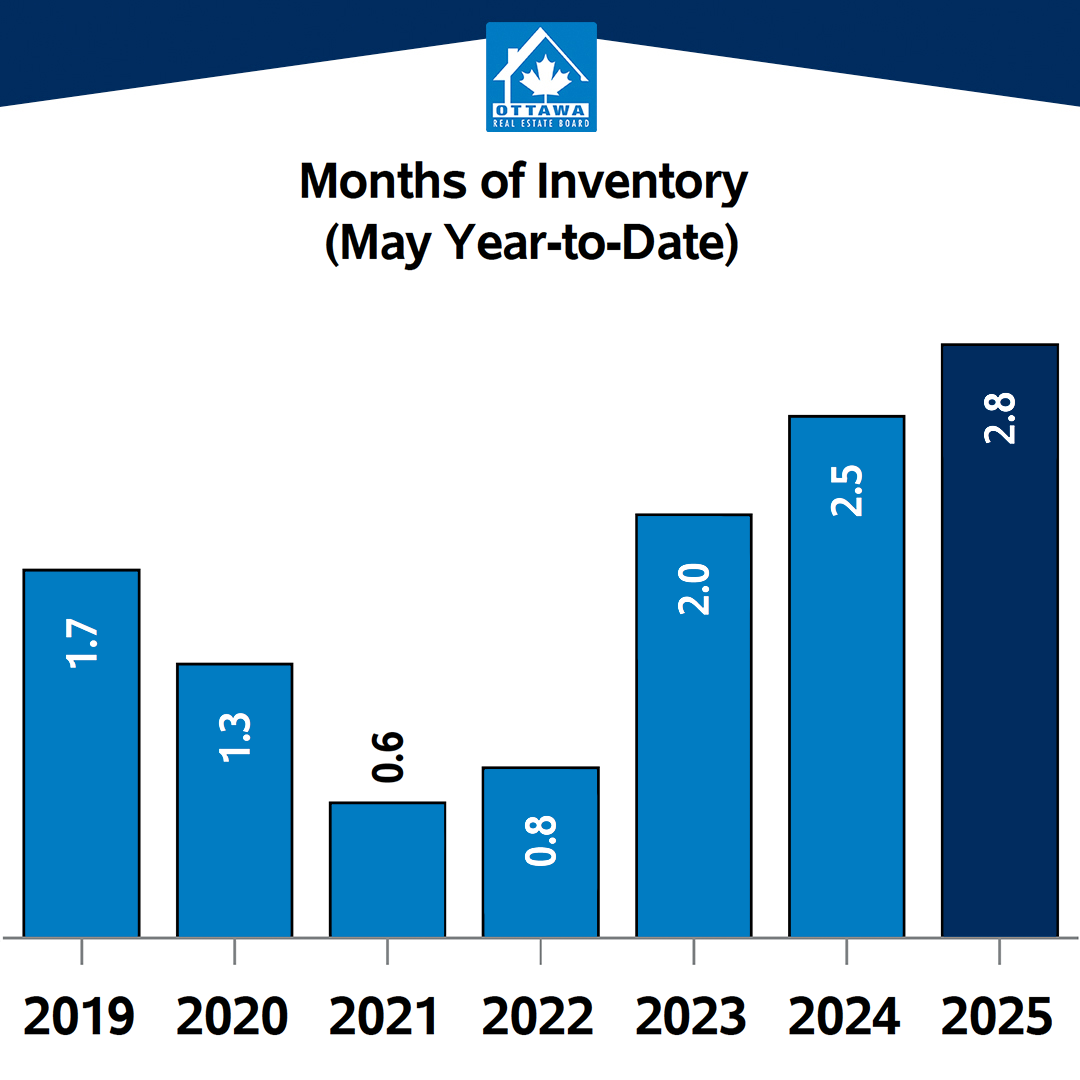
The sales-to-new-listings ratio was 48.8 per cent, while months of inventory reached 3.3. These are consistent with balanced market conditions, where neither buyers nor sellers have a major citywide advantage.
The sale-to-list price ratio remained at 98.5 per cent, unchanged from June 2025. Median days on market increased only modestly, from 19 days to 22 days.
This suggests that Ottawa is not seeing a broad market correction. Instead, buyers are becoming more selective, sellers are facing more competition and pricing discipline is becoming more important.
Ottawa Suburbs Continue to Drive Most Home Sales
Ottawa’s suburban markets accounted for more than 70 per cent of all June sales.
Ottawa Suburb South led the city with 382 sales, followed by Ottawa Suburb West with 373 sales and Ottawa Suburb East with 328 sales.
Ottawa Suburb West showed the strongest absorption conditions among the city’s seven submarkets, with the highest sales-to-new-listings ratio and the lowest months of inventory.
Ottawa Suburb East remained active but had more new listings available, giving buyers additional choice. Ottawa Centre recorded 143 sales and had higher inventory than the citywide average, while Ottawa Rural East was the only submarket to record year-over-year sales growth.
These differences reinforce why buyers and sellers should look beyond Ottawa-wide averages. A detached home in Kanata, a townhome in Barrhaven and a condo in Centretown may each be operating in very different market conditions.
What Could Affect the Ottawa Housing Market Later in 2026?
The Ottawa real estate market continues to operate in a cautious economic environment. The Bank of Canada held its policy rate in June, while Statistics Canada reported that real GDP grew in April after contracting in March.
Future housing conditions will depend on buyer confidence, mortgage rates, employment, population growth and the pace at which new homes enter the market.
Supply will be particularly important for Ottawa condos and apartment-style properties. CMHC reported 17,212 housing units under construction in Ottawa in May, including nearly 14,000 apartment units.
That does not mean Ottawa is facing an immediate oversupply. Completed and unabsorbed apartment inventory remained low, with 37 apartment units reported in May. However, future condo and apartment market conditions will depend on whether resale demand, rental demand, investor activity and population growth keep pace with new construction completions.
Ottawa’s rental market also remains relevant. CMHC reported a 3.0 per cent primary rental vacancy rate in Ottawa in 2025, while the condominium rental vacancy rate was much tighter at 0.6 per cent.
What This Means for Ottawa Buyers and Sellers
For Ottawa home buyers, June’s market offers more selection, especially in the townhome and condo segments. Buyers should still be prepared when the right property comes up, particularly in competitive detached-home neighbourhoods.
For Ottawa home sellers, the market remains active, but strategy matters more than it did during lower-inventory periods. Pricing based on current local comparable sales, preparing the home carefully and understanding direct competition can make a meaningful difference.
Ottawa’s market is balanced overall, but it is not one single market. Conditions vary by property type, neighbourhood, price range and building. Whether buying or selling, working with a local Ottawa REALTOR® who understands those micro-market differences can help you make decisions based on current conditions rather than broad headlines.

Important to note is that these statistics can only be as accurate as there are condos sold in Ottawa. The more condos sold in an area, the more accurate the averages will be.
Want to chat about your options? Fill out the form at the bottom of the page, or text/call us directly at 613-900-5700 or fill out the form at the bottom of the page.
Do you have any questions about how this information affects your investment or looking for more information to make the best decision about your purchase? Let’s chat! Fill out the form on the bottom of the page.