Every month we take a closer look and drill down the sales data of Ottawa condos from the previous month. Here are the statistics for January 2026 in the top five "downtown" areas - Centretown, Byward Market and Sandy Hill, Little Italy (which includes Lebreton Flats), Hintonburg, and Westboro. The information will be specific to apartment-style condominiums, and only what is sold through the MLS. Also important to note that DOM (Day's On Market) is calculated to include the conditional period, which in Ottawa is roughly 14 days for almost every single transaction.
Balanced Conditions Define Ottawa’s Housing Market in January 2026
Ottawa’s housing market opened 2026 in a noticeably more balanced position than what we have seen in recent years. Inventory remains higher than pandemic-era lows, giving buyers more choice and leverage, while sellers are adapting to a market that rewards accurate pricing and patience.
Across the board, benchmark prices are down year over year, with the softest conditions showing up in townhomes and apartments. Detached homes continue to demonstrate greater price stability. Overall, January’s data points to a market that is adjusting in an orderly, healthy way rather than one under stress.
As noted by Ottawa Real Estate Board, the current environment reflects realism on both sides of the transaction. Buyers are cautious but active, and sellers are adjusting expectations without sharp price swings. That balance is an important signal heading into the spring market.
Market Activity Shows Steady Demand Beneath Seasonal Slowdown
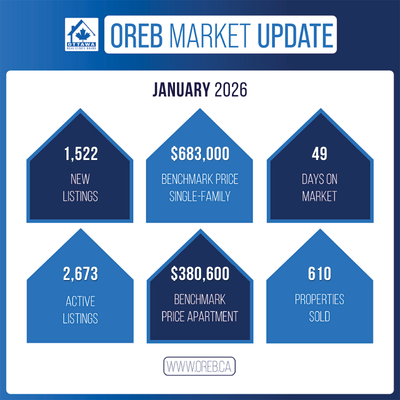
January recorded 610 residential sales in Ottawa. While this represents a typical post-holiday slowdown, activity remained within long-term January norms. Sales were 5.6 percent lower than January 2025, but demand has not disappeared. Buyers are still in the market, just more deliberate due to affordability and economic uncertainty.
Pricing followed expected winter patterns rather than signaling renewed weakness. The average residential sale price came in at $641,436, down 4.5 percent year over year. Recent interest rate reductions have started to ease pressure at the margins, but their impact is showing up first in buyer engagement rather than finalized transactions.
Benchmark pricing from the MLS Home Price Index also declined modestly month over month across all housing types. These shifts suggest seasonal cooling combined with a more price-sensitive buyer pool, not a market correction.
Inventory Levels Support a More Balanced Market
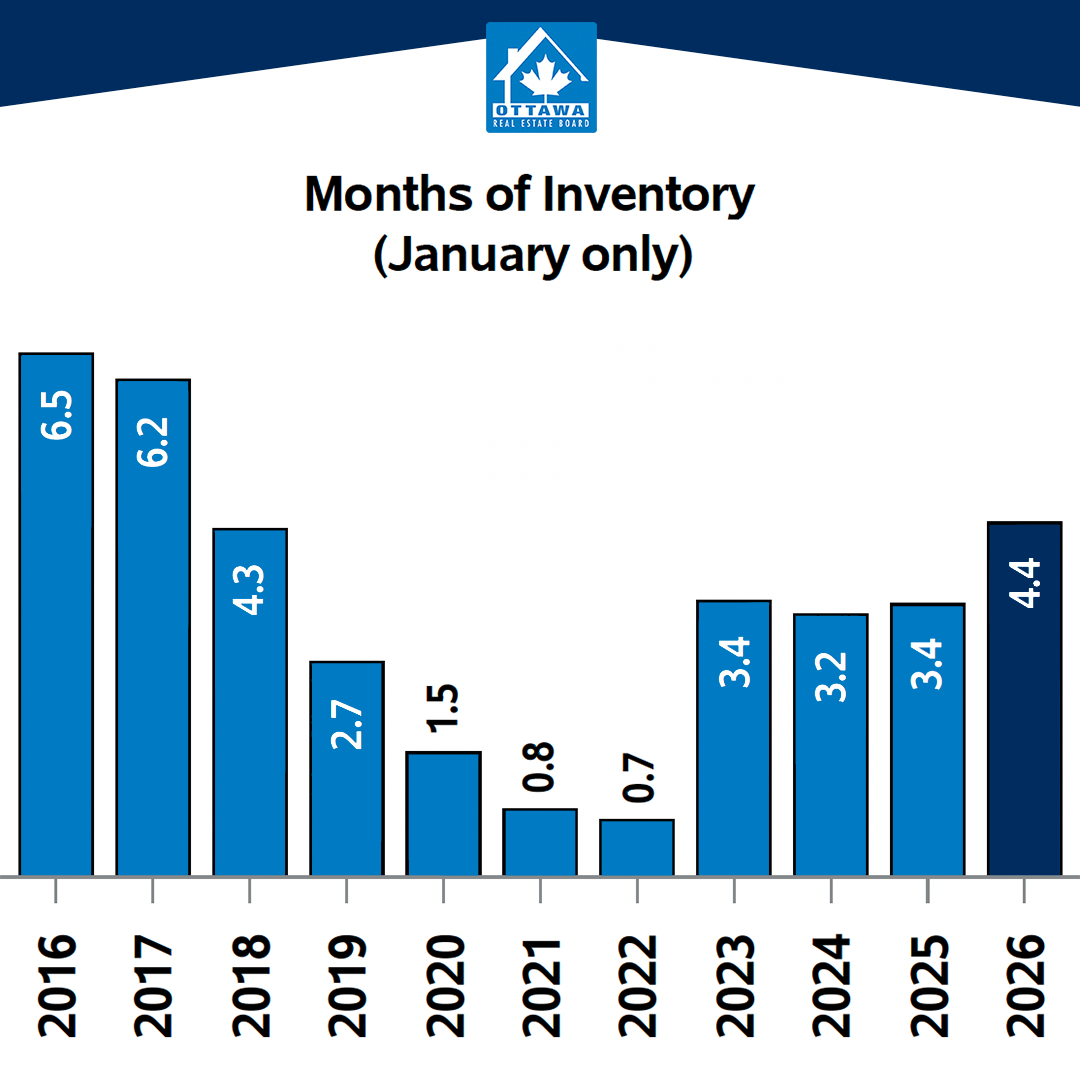
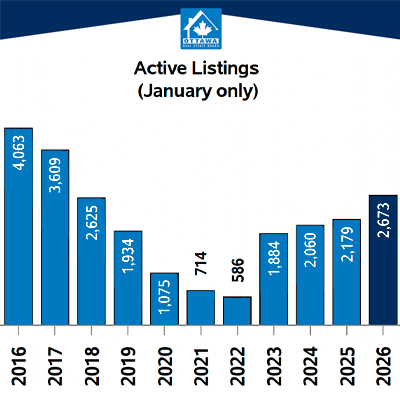
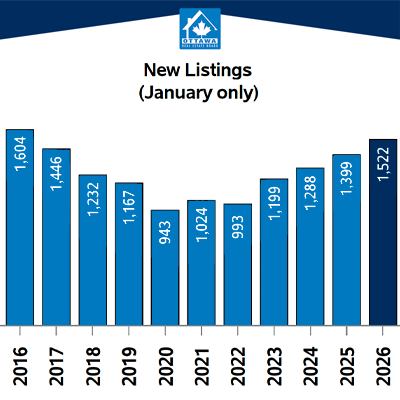
New listings totalled 1,522 units in January, an increase of 8.8 percent year over year. Active listings rose to 2,673, up 22.7 percent from last January. While inventory remains elevated compared to recent seasonal norms, the pace of growth has slowed.
Months of inventory now sits at 4.4, which is much closer to long-term, pre-pandemic averages. This level of supply gives buyers more choice and negotiating room while still allowing well-priced homes to attract meaningful interest. Rather than pushing prices sharply downward, current inventory levels are supporting stability.
How the Market Is Performing by Property Type
Detached Homes
Detached properties remained the most stable segment in January. A total of 276 single-family homes sold, down 13.8 percent year over year. Supply remained balanced at 4.3 months of inventory, with 1,177 active listings and 663 new listings, essentially unchanged from last year.
Pricing softened slightly but held firm overall. The average sale price was $793,874, down 3.6 percent year over year. The median price remained steady at $750,000. These figures suggest detached home pricing is adjusting gradually rather than experiencing sharp declines.
Townhomes
Townhome activity showed mixed signals. Sales increased to 215 units, up 6.4 percent year over year, but new listings rose sharply to 487, a 45.8 percent increase from January 2025. Active listings climbed to 708, up 67 percent year over year.
With supply expanding faster than demand, months of inventory rose to 3.3. Pricing reflected this shift. The average townhouse sale price was $536,106, down 3.3 percent year over year, while the median price declined to $560,000. Notably, the townhouse benchmark price rose slightly month over month, suggesting some short-term stabilization.
Apartments and Condos
The apartment segment showed early signs of improvement compared to late 2025. Condo sales increased to 95 in January, up from 78 in December, while months of inventory declined to 6.8 from 7.9. This indicates stronger absorption despite higher listing activity.
New listings increased significantly to 312, and active listings rose to 647. Even with this seasonal influx of supply, improved sales activity prevented further deterioration in market balance.
Pricing remains the most sensitive in this segment. The average apartment sale price dropped to $388,307, down 12.1 percent year over year. However, the combination of rising sales and declining months of inventory suggests condo conditions may be beginning to stabilize.
Months of Inventory Snapshot
Single-family homes: 4.3
Townhomes: 3.3
Apartments: 6.8
What This Means Moving Forward
January’s data reflects a familiar winter pattern with slower sales and cautious buyers. At the same time, there are early signs that market conditions are firming, particularly in the apartment segment where absorption improved.
Detached homes continue to show resilience, townhome activity remains active despite rising supply, and condos appear to be finding a floor after a prolonged adjustment. Overall, Ottawa’s housing market is segmented by property type but remains balanced at a broader level.
This aligns with national forecasts pointing toward gradual improvement as interest rates ease and sidelined demand begins to re-enter the market. If rate reductions continue, January’s data supports a credible case for a stronger and more active spring market.
Important to note is that these statistics can only be as accurate as there are condos sold in Ottawa. The more condos sold in an area, the more accurate the averages will be.
Want to chat about your options? Fill out the form at the bottom of the page, or text/call us directly at 613-900-5700 or fill out the form at the bottom of the page.
Do you have any questions about how this information affects your investment or looking for more information to make the best decision about your purchase? Let’s chat! Fill out the form on the bottom of the page.