Every month we take a closer look and drill down the sales data of Ottawa condos from the previous month. Here are the statistics for September 2025 in the top five "downtown" areas - Centretown, Byward Market and Sandy Hill, Little Italy (which includes Lebreton Flats), Hintonburg, and Westboro. The information will be specific to apartment-style condominiums, and only what is sold through the MLS. Also important to note that DOM (Day's On Market) is calculated to include the conditional period, which in Ottawa is roughly 14 days for almost every single transaction.
Ottawa Market Snapshot: A Softening in Sales, But Prices Holding Firm
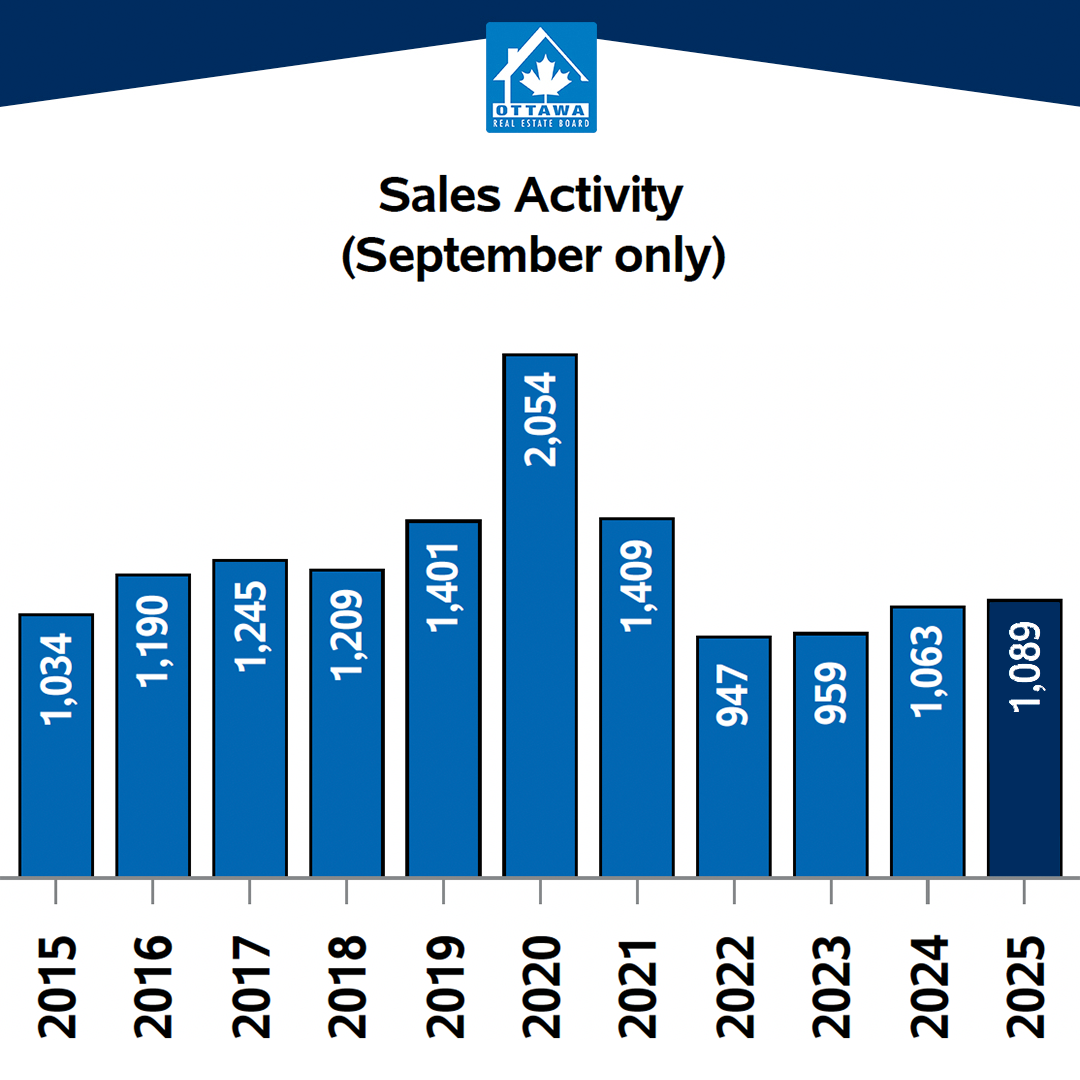
As summer transitions toward fall, Ottawa’s housing market in September followed a familiar seasonal pattern: sales cooled slightly even as inventory continued to build. A total of 1,089 homes changed hands in September, down from 1,236 in August and 1,318 in July. While the three-month pullback might unsettle some, it’s well within the norm as the frenzied spring market winds down.
Despite the dip in activity, home prices showed surprising resilience. The average sale price landed at $690,397, settling between August’s $686,536 and July’s $695,209 — and registering a modest 0.3% gain over last year. At the same time, benchmark prices have remained steady, signaling that demand is holding strong even as buyers now have more inventory to choose from.
Inventory Piling Up, But Market Still Finding Balance
Active listings rose to 4,388 in September, up from 3,971 in August and 4,205 in July. These levels reflect a marked shift away from the supply-constrained days of the pandemic and toward what might be considered a more “balanced” market — though it’s worth noting inventory is still elevated compared to historical norms.
The months of inventory metric edged up to 4.0 in September (versus 3.2 in August and July), further reinforcing that we may be entering a phase of increased equilibrium between buyers and sellers.
That demand hasn’t collapsed is a key reason why prices haven’t plunged — even with more homes on the market.
The Policy Shift That Could Stir Things Up
Mid-month, the Bank of Canada cut its key policy rate by 25 basis points to 2.5%, pointing to slowing global growth and easing inflation pressures. This move may well give new life to the market — especially among first-time buyers who may see renewed affordability and confidence in the months ahead.
Coupled with Ottawa’s structural demand and increasingly balanced inventory, this rate cut could nudge some hesitant buyers off the sidelines.
Driving Forces Under the Hood
Paul Czan, President of OREB, sums it up best:
“September reinforced Ottawa’s resilience, with sales nearly 2.4% higher than last year, and prices are holding steady despite more listings coming to market. When you peel back the layers, you see that townhomes are driving stability while single-family homes are easing. And while Ottawa’s diversity of housing continues to increase inventory, missing middle housing — like townhomes — still aren’t being built fast enough, and that’s something OREB continues to advocate for.”
That last point is especially worth emphasizing: even as inventory expands, the market’s composition matters. If new supply skews too heavily toward certain types (e.g. large single-family homes) while under-serving in-demand middle housing (townhomes, semi-detached), the pressure points in certain segments could intensify.
Broader Trends & Year-To-Date Performance
Looking beyond monthly fluctuations:
11,025 homes have sold so far in 2025 — up 3.9% compared to the same period in 2024.
Year-to-date average sale price: $699,910, a 2.7% increase over last year’s first nine months.
Total value of homes sold in September was around $751 million, a 2.8% increase year-over-year — underscoring real estate’s continued macroeconomic weight.
New residential listings added in September: 2,832 (a 19.3% increase over Sept. 2024)
Active listings: 4,388 (up 19.4% over last year, and about 21.8% above the five-year seasonal average)
MLS® HPI (Home Price Index): The composite benchmark was $627,200 in September (≈ 1.1% gain year-over-year)
Single-family HPI: $697,200 (+1.0%)
Townhouse HPI: $462,800 (+7.8%)
Apartment HPI: $408,200 (–1.7%)
What This Means Going Forward
Balanced, not overheated: The market is nudging toward greater balance. That doesn’t necessarily mean price drops — it just means less frantic movement in either direction.
Segment shifts matter: While overall numbers may look stable, townhomes and “missing middle” forms of housing are continuing to outperform — and in some respects, are under-supplied.
Interest rate tailwinds: The Bank of Canada’s recent rate cut could boost buyer confidence, especially among new entrants to the market, helping convert latent demand into actual transactions.
Watch for inventory trends: If listings keep climbing faster than buyers emerge, we could see localized softening — particularly in overbuilt or less desirable submarkets.
Bottom line: Ottawa’s housing market in September reminds us that even as inventory climbs, underlying demand remains resilient. Prices may not be shooting higher, but they’re not collapsing either. The key going into fall will be watching how buyers respond — especially with lower interest rates — and which housing segments outperform.


Important to note is that these statistics can only be as accurate as there are condos sold in Ottawa. The more condos sold in an area, the more accurate the averages will be.
Want to chat about your options? Fill out the form at the bottom of the page, or text/call us directly at 613-900-5700 or fill out the form at the bottom of the page.
Do you have any questions about how this information affects your investment or looking for more information to make the best decision about your purchase? Let’s chat! Fill out the form on the bottom of the page.