Every month we take a closer look and drill down the sales data of Ottawa condos from the previous month. Here are the statistics for June 2025 in the top five "downtown" areas - Centretown, Byward Market and Sandy Hill, Little Italy (which includes Lebreton Flats), Hintonburg, and Westboro. The information will be specific to apartment-style condominiums, and only what is sold through the MLS. Also important to note that DOM (Day's On Market) is calculated to include the conditional period, which in Ottawa is roughly 14 days for almost every single transaction.
A Busy June Signals a Delayed but Active Spring Market
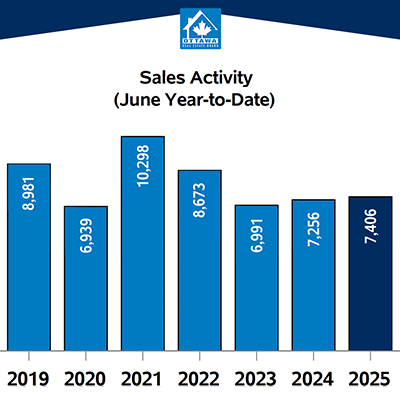
Ottawa's real estate market saw a notable uptick in activity this June, marking a strong seasonal shift. A total of 1,602 homes were sold through the Ottawa Real Estate Board's (OREB) MLS® System—an 11.34% drop from May, but a healthy 10.6% increase compared to June 2024. This pace puts the city’s sales 3.8% above the five-year average, pointing to a return to more traditional seasonal trends.
Market Trends at a Glance
Sales activity: 1,602 homes sold
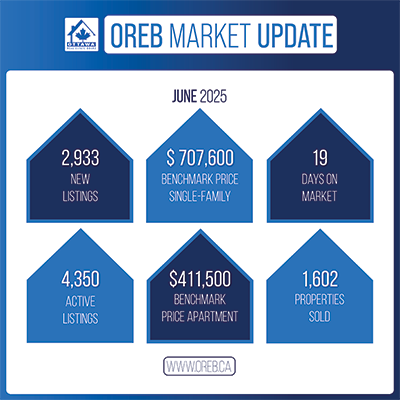
New listings: 2,933 (↑13.8% YoY)
Active listings: 4,350 (↑11.6% YoY)
Benchmark price (overall): $634,300 (↑1.6% YoY)
Average sale price: $723,152 (↑5.2% YoY)
Days on market: 19
Months of inventory: 2.7
OREB President Paul Czan noted, “This was the busiest June we've seen in quite some time… we’re seeing more inventory hit the market, giving buyers more choice. Sellers need to stay future-focused—pricing thoughtfully and preparing their homes to stand out.”
Inventory Continues to Climb
Active listings reached 4,350 in June, rising significantly from last year and sitting 42.6% above the five-year average. New listings also jumped nearly 14% year-over-year, indicating that the delayed spring market finally materialized. Months of inventory held steady at 2.7, suggesting balanced conditions overall.
Property Prices by Type
The benchmark price of a typical home in Ottawa climbed modestly overall, with certain property types seeing more pronounced movement:
Single-family homes: $707,600 (↑1.6% YoY)
Townhouses/row units: $467,900 (↑9.0% YoY)
Apartments: $411,500 (↓0.6% YoY)
Apartments continue to feel pressure from rising inventory, financing costs, and new construction competition. “We're seeing a notable decline in apartment sales—down about 20% year-over-year,” Czan explained. Neighbourhood-specific factors and increasing condo fees are also contributing to reduced affordability, particularly for first-time buyers.
What This Means for Buyers and Sellers
For buyers, increased inventory and stable pricing mean more options and a less competitive market than in past years. For sellers, especially those listing condos or homes in areas with lots of new supply, strategic pricing and preparation are essential to attract serious interest.
Looking ahead, seasonal trends suggest a strong fall market could be on the horizon. Families hoping to move before the school year and students returning to the city are likely to keep the market moving into September.
Thinking about buying or selling in Ottawa?
Our team of local experts is here to help you navigate changing market conditions with confidence. Reach out today for personalized advice or to start your home search.


Important to note is that these statistics can only be as accurate as there are condos sold in Ottawa. The more condos sold in an area, the more accurate the averages will be.
Want to chat about your options? Fill out the form at the bottom of the page, or text/call us directly at 613-900-5700 or fill out the form at the bottom of the page.
Do you have any questions about how this information affects your investment or looking for more information to make the best decision about your purchase? Let’s chat! Fill out the form on the bottom of the page.