Every month we take a closer look and drill down the sales data of Ottawa condos from the previous month. Here are the statistics for December 2025 in the top five "downtown" areas - Centretown, Byward Market and Sandy Hill, Little Italy (which includes Lebreton Flats), Hintonburg, and Westboro. The information will be specific to apartment-style condominiums, and only what is sold through the MLS. Also important to note that DOM (Day's On Market) is calculated to include the conditional period, which in Ottawa is roughly 14 days for almost every single transaction.
Ottawa Housing Market Wrap-Up: How 2025 Ended and What It Signals Going Forward
Ottawa’s housing market closed out 2025 much the way it spent most of the year: calm, measured, and grounded in fundamentals rather than momentum or pressure.
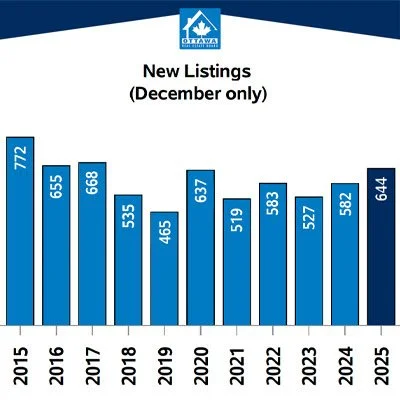
December brought the expected seasonal slowdown. Sales eased, new listings declined, and inventory pulled back as the holidays approached. Prices, however, held steady. When the full year is viewed as a whole, the takeaway is not softness or weakness, but balance.
Despite a quieter finish, total residential sales for 2025 ended 1.3 percent higher than 2024, with total dollar volume up 4.1 percent year over year. That combination points to a market that remained functional and resilient, even as buyer behaviour became more cautious in the second half of the year.
A Year That Didn’t Follow the Usual Script
2025 did not behave like a typical Ottawa market year.
Spring arrived later than expected, with activity taking time to build after winter. Instead of the usual summer slowdown, sales remained steady through mid-year, before easing again through the fall and early winter months. That unconventional rhythm reinforced what many buyers and sellers felt on the ground: this was not a market driven by urgency or fear of missing out, but by deliberation.
Compared with sharper price corrections seen in some larger Canadian cities, Ottawa continued to show relative stability. That stability, however, was not uniform across all property types.
December Activity in Context
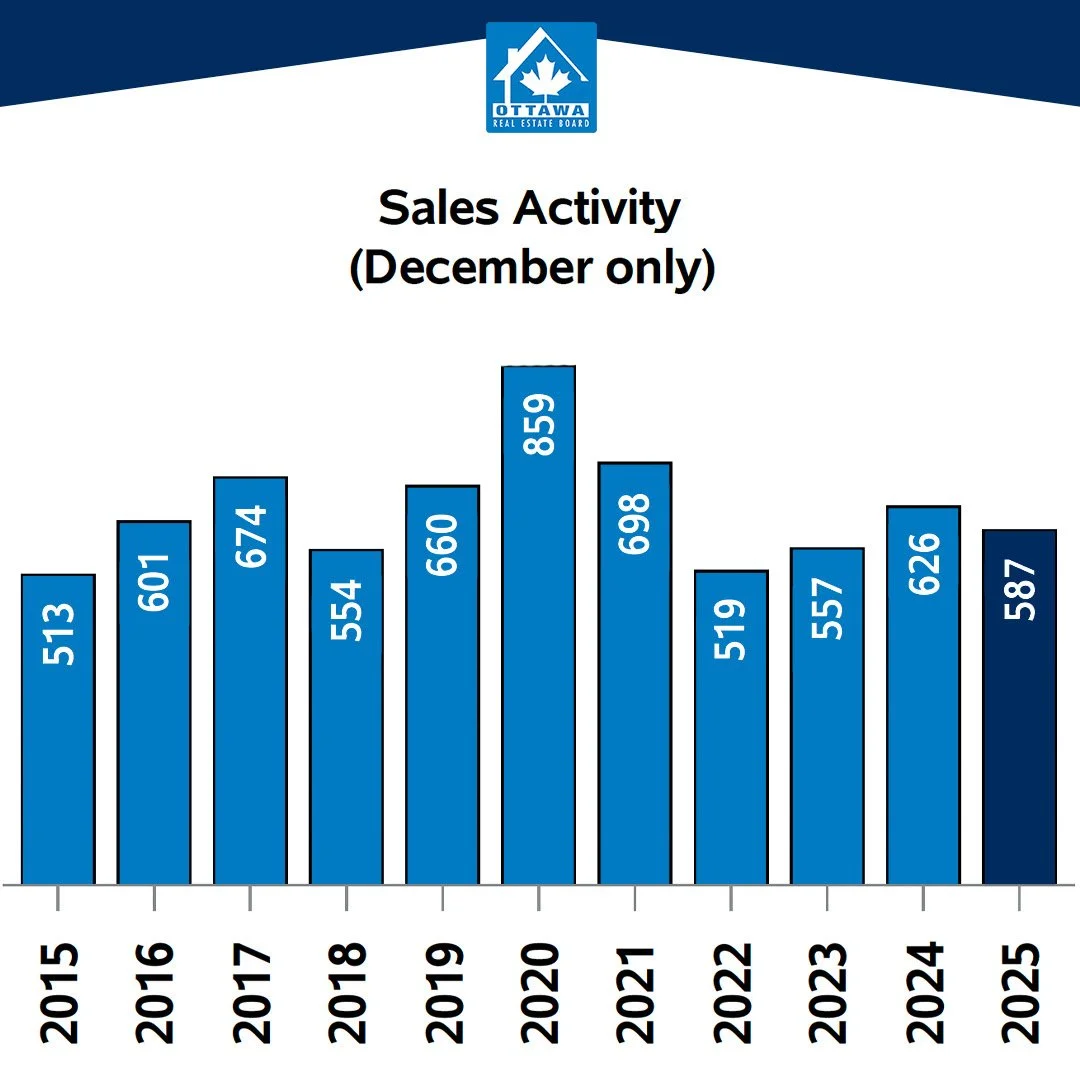
In December, 587 residential properties sold. That figure represents a 32 percent drop from November, but it aligns closely with long-term December norms when excluding the unusually active pandemic years. Since 2018, average December sales have hovered around this level.
The slowdown reflects both seasonality and ongoing buyer caution. Buyers are active, but deliberate.
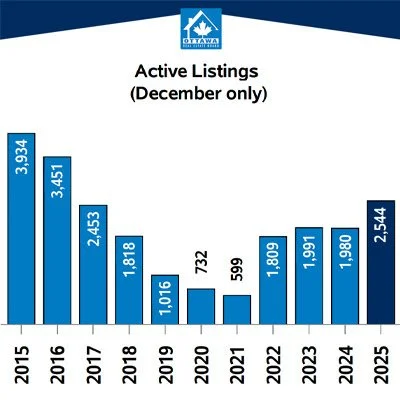
On the supply side, active listings declined from 3,628 in November to 2,544 in December, which is typical for the holiday period. Even so, inventory levels remain elevated compared with recent December benchmarks.
Looking at longer-term trends, Ottawa has been building toward higher year-end inventory levels since 2022. By December 2025, active listings were 19 percent higher than the same time last year, 45 percent higher than 2023, and nearly double 2022 levels. Months of inventory rose to 4.3, closer to pre-pandemic norms and firmly within balanced market territory.
Prices: Stable, Not Accelerating
Price movement in December reinforced the theme of stability.
The average residential sale price came in at $658,943, effectively unchanged from December 2024. This follows a modest year-over-year increase in November and suggests prices are being supported by demand, but not pushed upward aggressively.
The MLS Home Price Index adds nuance. Benchmark prices have edged down month over month since the summer, yet still finished 2025 slightly above 2024 overall. This tells a clear story: price adjustment is happening gradually and unevenly, influenced by property type and sales mix rather than broad market weakness.
Buyers today have more negotiating room than in recent years. Sellers, particularly in stronger segments, continue to benefit from resilient pricing.
How Different Property Types Performed
Market conditions varied significantly depending on the type of home.
Single-Family Homes
Detached homes remained the most stable segment in December. With 4.3 months of inventory, supply and demand stayed well balanced. The single-family benchmark price increased 0.4 percent year over year, underscoring the continued strength of this segment. Limited availability and consistent demand continue to make detached homes the backbone of Ottawa’s market.
Townhomes
Townhomes showed signs of adjustment as inventory stayed slightly elevated. The benchmark price declined 3.7 percent year over year, while the average sale price fell just 1.4 percent. That gap suggests benchmark-level softness rather than widespread discounting. Interest from first-time buyers continues to support transaction prices, keeping this segment relatively resilient despite increased choice.
Apartments and Condos
Condos remained the softest part of the market. Sales were subdued in December, and months of inventory climbed to nearly eight, well above balanced conditions. The benchmark price declined year over year, reflecting supply outpacing demand. While Ottawa has not experienced the same scale of condo oversupply seen in larger urban centres, this segment bears close watching heading into 2026.
Current months of inventory by segment:
Single-family homes: 4.3
Townhomes: 2.8
Apartments and condos: 7.9
What This Means Heading Into 2026
As the new year begins, the data suggests improvement in activity will likely be gradual rather than immediate. Interest rate relief has helped stabilize confidence, but buyers remain attentive to broader economic signals and affordability considerations.
For sellers, pricing accurately and understanding segment-specific conditions will matter more than ever. For buyers, increased inventory continues to offer choice and leverage, particularly in the condo market.
The broader message is consistent and clear. Ottawa’s housing market is stable, segmented, and increasingly shaped by fundamentals rather than urgency. Modest fluctuations are likely in 2026, but the underlying tone remains one of balance rather than volatility.
For anyone buying or selling in Ottawa this year, understanding how these conditions play out by property type and neighbourhood will be key.

Important to note is that these statistics can only be as accurate as there are condos sold in Ottawa. The more condos sold in an area, the more accurate the averages will be.
Want to chat about your options? Fill out the form at the bottom of the page, or text/call us directly at 613-900-5700 or fill out the form at the bottom of the page.
Do you have any questions about how this information affects your investment or looking for more information to make the best decision about your purchase? Let’s chat! Fill out the form on the bottom of the page.