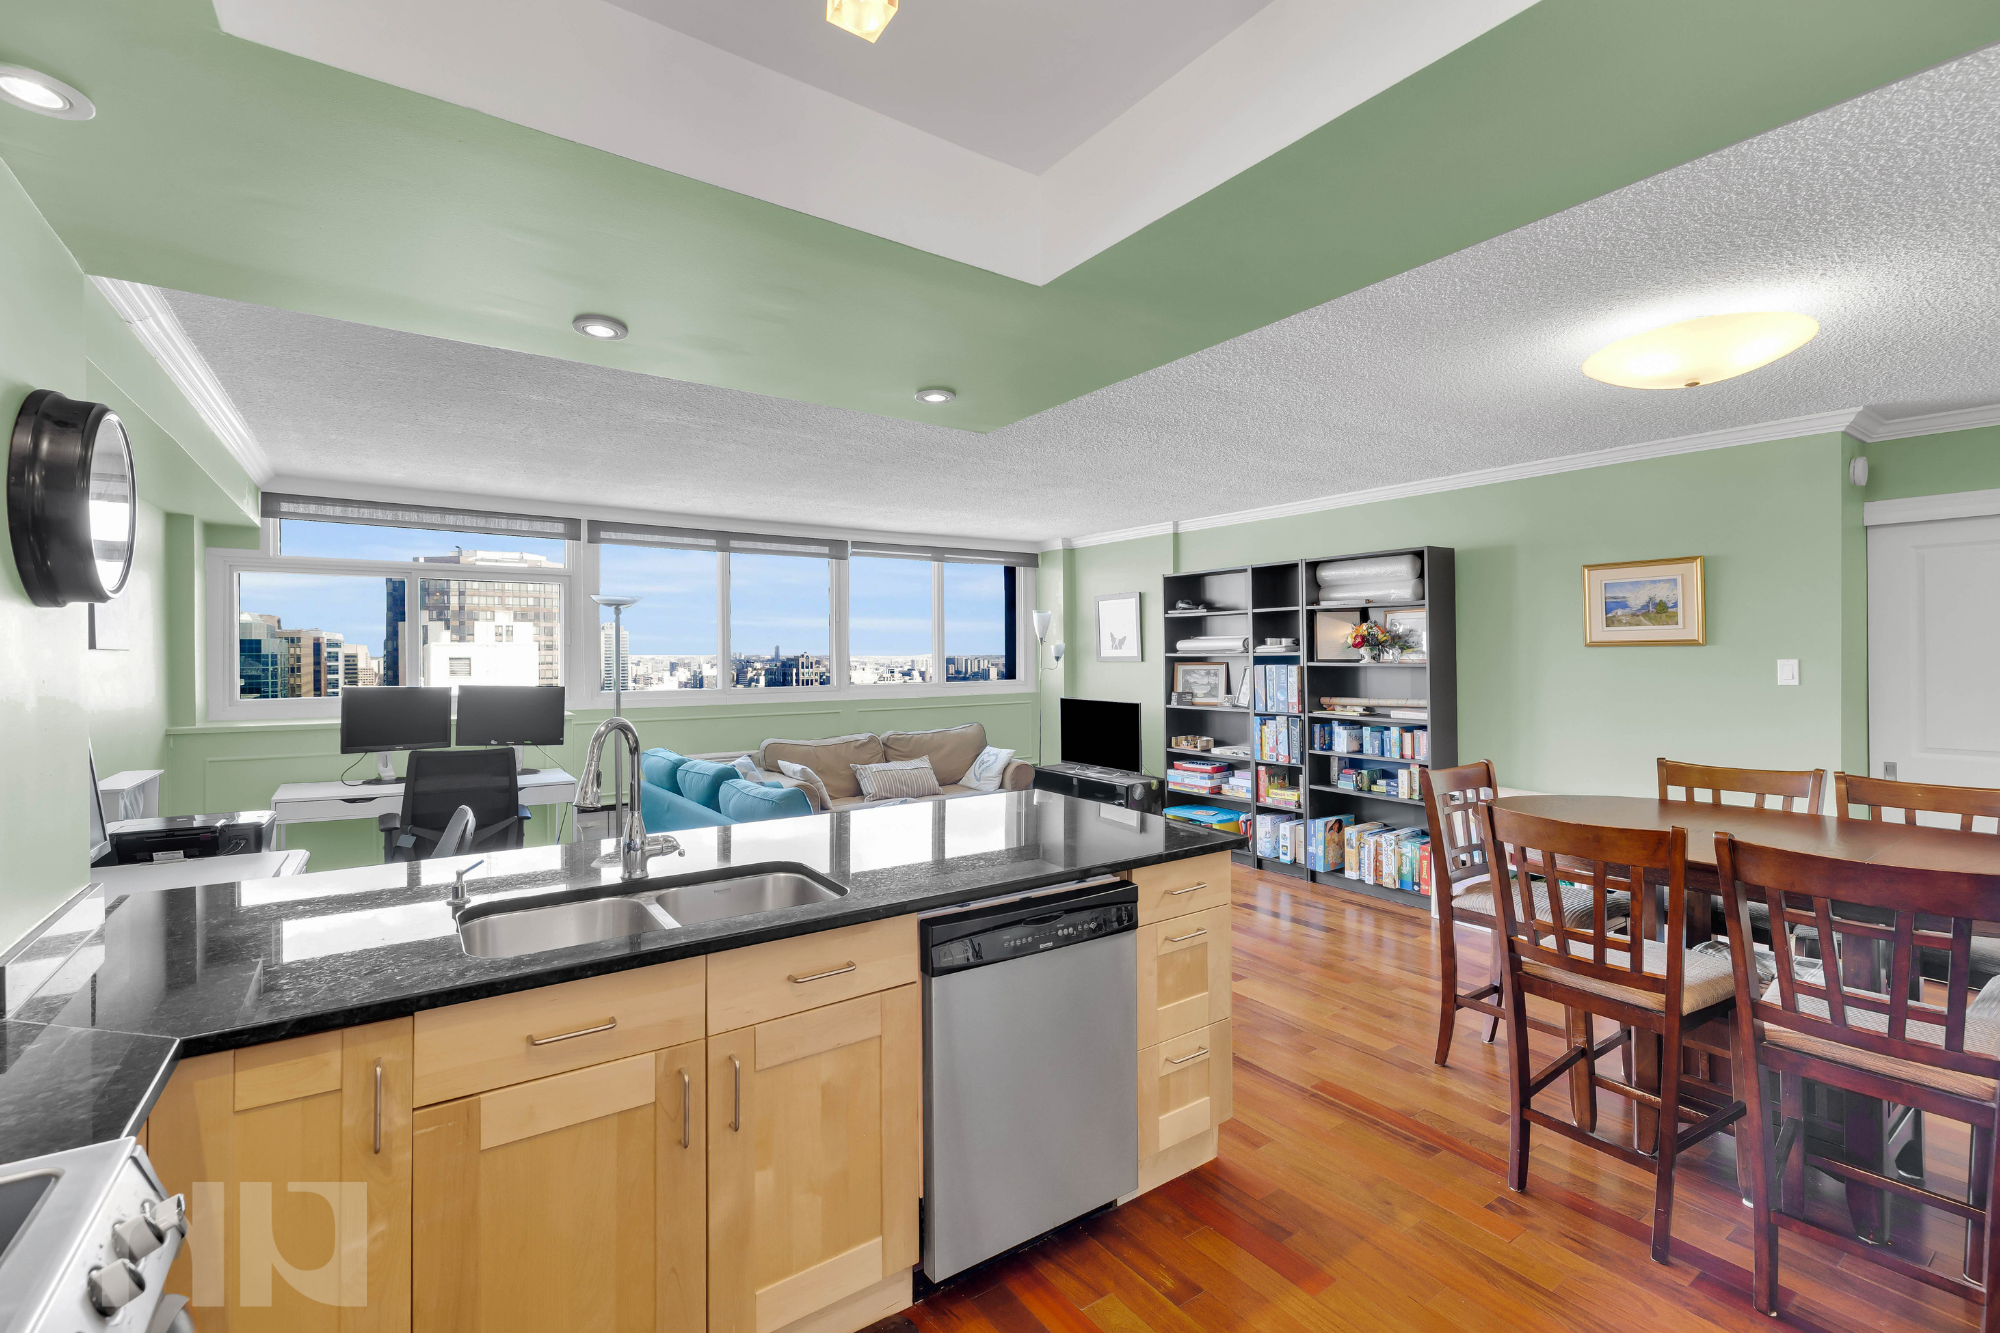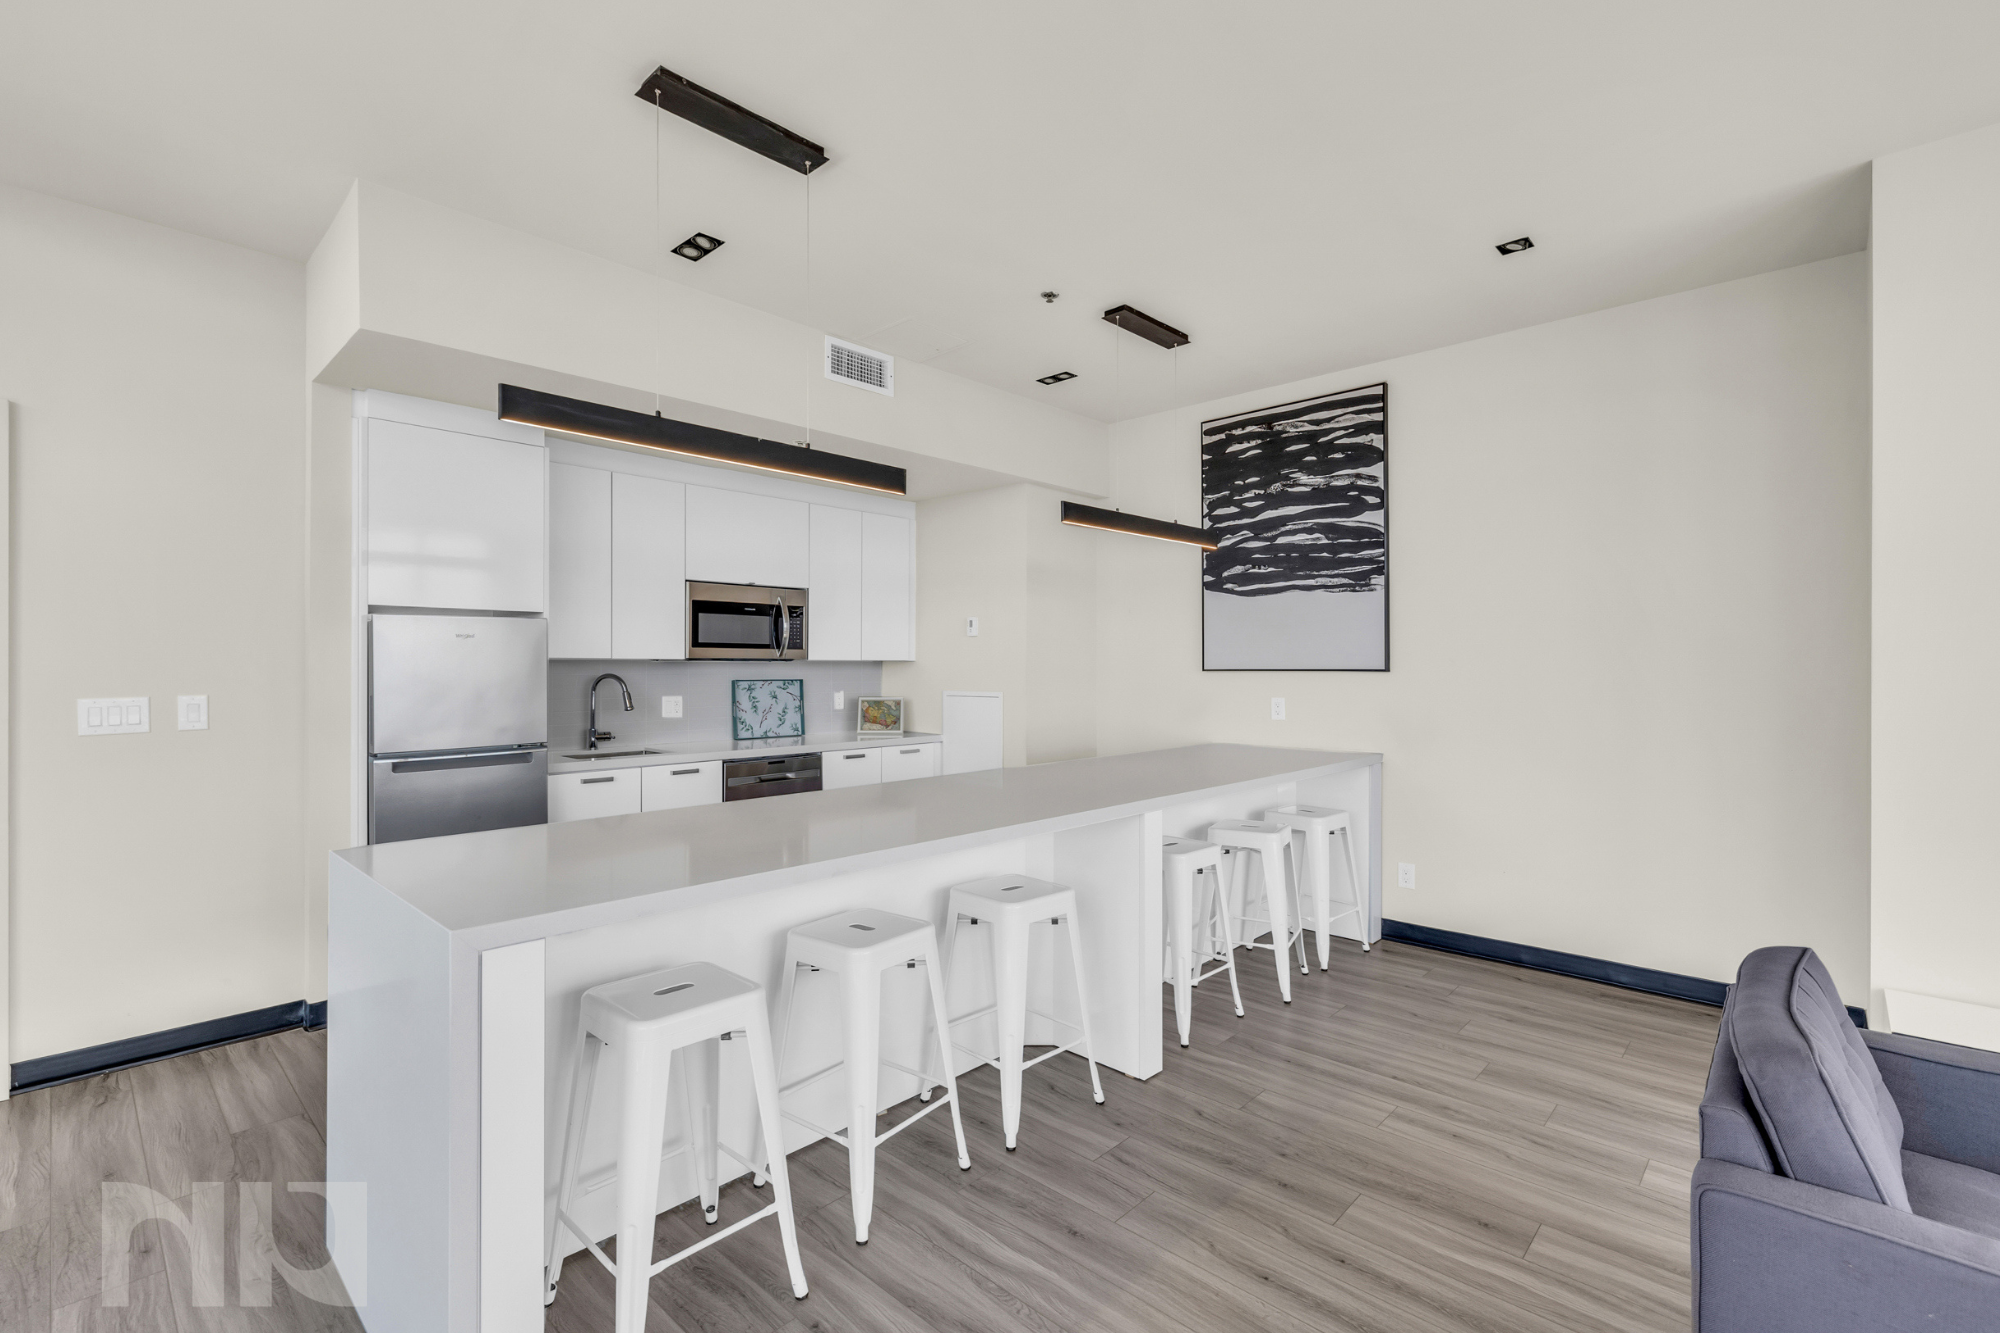

Every month we take a closer look and drill down the sales data of Ottawa condos from the previous month. Here are the statistics for September 2026 in the top five "downtown" areas - Centretown, Byward Market and Sandy Hill, Little Italy (which includes Lebreton Flats), Hintonburg, and Westboro. The information will be specific to apartment-style condominiums, and only what is sold through the MLS. Also important to note that DOM (Day's On Market) is calculated to include the conditional period, which in Ottawa is roughly 14 days for almost every single transaction.
Ottawa home sales held steady in September, but a surge of new listings shifted the market further toward buyers.
Sales barely moved from August, which is unusual for September. The bigger change was supply. Far more homes came onto the market than is normal for this time of year, roughly the same number sold, and the MLS® Home Price Index posted its largest August-to-September decline since the series began in 2005.
Last month we asked whether August was a one-off or the start of a longer slowdown. September answered part of that question. Sales stopped falling, but they didn't bounce back either, and the gap between homes listed and homes sold kept widening.
Ottawa Home Sales Held Near August Levels
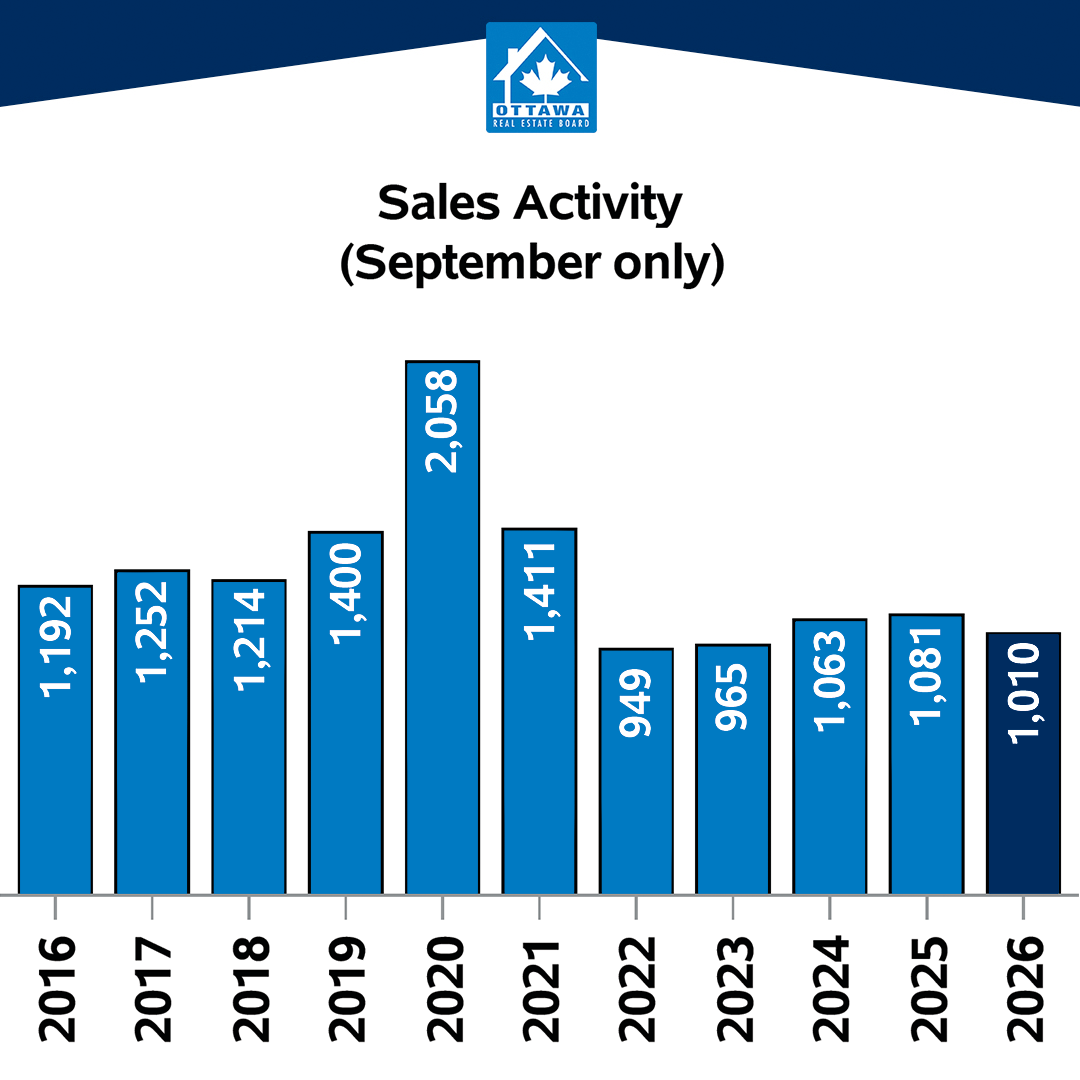
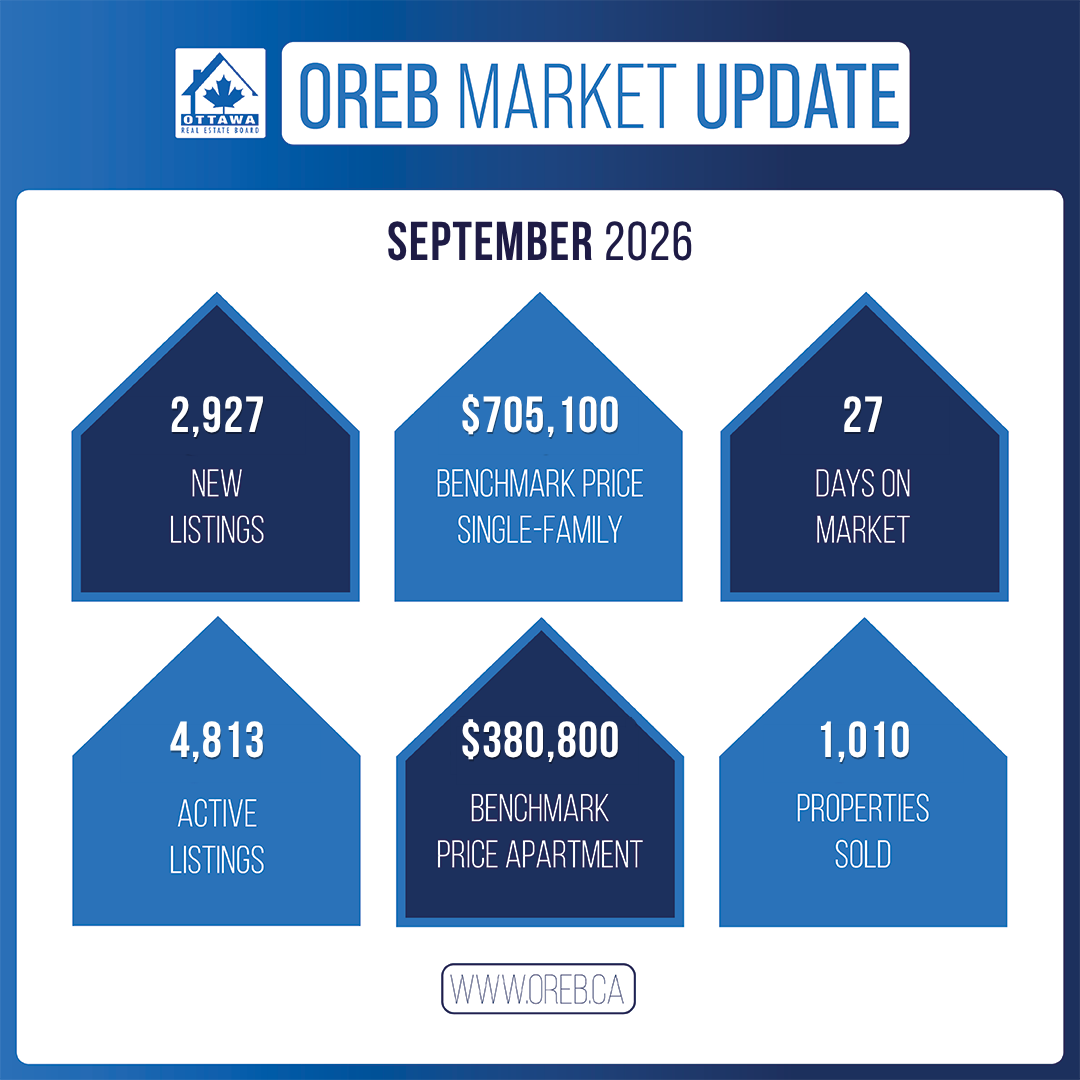
A total of 1,010 homes sold through the Ottawa MLS® System in September 2026, down 6.6% from September 2025 and up 0.8% from August, when 1,002 homes sold.
That small increase is better than the usual seasonal pattern. Only one of the previous 10 August-to-September periods produced an increase in sales, and the median change was a decline of 5.9%.
Looking at the summer as a whole, 3,336 homes sold from July through September, down 8.2% from the same period in 2025 and the third-lowest summer total since 2016. Sales fell roughly 24% from July to August, then edged up in September, which makes September look more like stabilization than a rebound.
Sales were lower than a year earlier across all three major property types:
Single-family homes: 535 sales, down 4.6% year over year
Townhomes: 329 sales, down 3.5%
Apartments: 121 sales, down 24.8%
Apartments accounted for more than half of the net year-over-year drop in citywide sales.
Year to date, 10,288 homes have sold in Ottawa, down 6.9% from the same period in 2025. Total dollar volume was approximately $7.2 billion, down 7.3%.
Average Prices Held, but the Benchmark Price Fell
The average residential sale price was $685,640 in September, down 1.0% from a year earlier and nearly unchanged from August.
The median sale price was $625,000, down 0.8% year over year and slightly higher than in August. From July through September, the average price stayed within a range of less than 1%.
The MLS® Home Price Index told a different story. The composite benchmark price was $623,500, down 0.3% from September 2025 and down 2.2% from August.
The gap comes down to what each number measures. Average and median prices depend on which homes happened to sell in a given month, so a larger share of detached or higher-priced sales can hold the average up even while values soften. The HPI tracks the estimated price of a representative home with consistent features, which filters out that effect.
September's 2.2% monthly drop was the largest August-to-September decline in Ottawa's HPI since the series began in 2005. Even after adjusting for normal seasonal patterns, the benchmark fell 1.5%, also the largest September decrease on record.
Last month we noted that falling sales don't automatically mean falling values. September is the first month this fall where the benchmark points to some underlying price softness. OREB is clear that one month alone doesn't establish a trend, but it's worth watching closely.
New Listings Jumped 38% in One Month
There were 2,927 new listings in Ottawa during September, up 3.0% from a year earlier and up 38.1% from August.
Some increase is normal as the fall market starts, but the median August-to-September increase over the previous 10 years was 12.9%. From July through September, 7,576 homes were newly listed, the highest total for those three months since 2016, while sales over the same stretch were the third-lowest.
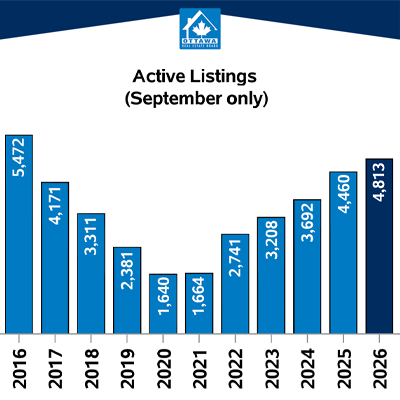
Active listings reached 4,813, up 7.9% year over year and 7.1% from August. That's the second-highest September level since 2016.
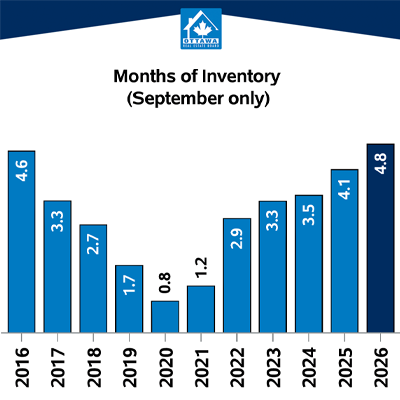
The sales-to-new-listings ratio fell from 47.3% in August to 34.5% in September, which works out to about one sale for every three new listings. Months of inventory rose from 4.5 to 4.8. Among September results over the past decade, this year had the lowest sales-to-new-listings ratio and the highest months of inventory.
Homes Are Taking Longer to Sell
Homes sold for an average of 97.5% of their listing price, compared with 98.1% last September. In August, that figure was unchanged from the year before, so September is the first month this fall where sellers are giving up a little more off asking.
The median time on market rose to 27 days, up from 22 days a year earlier.
Single-Family Homes: Steady Year Over Year, Softer Since August
The single-family benchmark price was $705,100, nearly unchanged from a year earlier but down 3.0% from August. Months of inventory came in at 4.4.
In August, single-family homes were Ottawa's most stable segment, with the benchmark up 2.2% year over year. That year-over-year gain is now essentially gone. Detached homes are still holding up better than condos over the past year, but September's monthly drop is the most notable change in this segment so far this fall.
Townhomes Were the Steadiest Segment in September
After a soft August, townhomes held their ground. The townhome benchmark price was $546,500, down 2.2% from a year earlier but essentially unchanged from August.
Townhomes also had the lowest months of inventory of the three major property types at 4.0, and the smallest year-over-year drop in sales at 3.5%.
Buyers still have more townhome options than they did in tighter markets, but this segment didn't weaken further in September the way single-family and apartment benchmarks did.
Ottawa Condo and Apartment Market Remains the Softest Segment
Apartment-style properties continued to have the softest conditions in Ottawa.
Months of inventory rose from 6.3 to 7.3, while the sales-to-new-listings ratio fell from 43.0% to 27.0%. The apartment benchmark price was $380,800, down 6.1% from a year earlier and 3.1% from August.
The average apartment sale price actually rose 0.9% year over year, but the benchmark suggests that a shift in which condos sold propped up the average rather than values rising. The few signs of stabilization we saw in August didn't carry into September, and apartment supply continues to build relative to sales.
CMHC also expects Ottawa's rental market to soften as a large construction pipeline is completed. Most of that new supply is purpose-built rental, not resale condos, so it isn't a direct addition to resale inventory. It may still affect condo demand as renters and would-be buyers weigh a wider range of options.
Which Parts of Ottawa Were Strongest in September?
Ottawa's three suburban markets accounted for 734 sales, or 72.7% of citywide activity. Their combined sales were down 8.0% from 798 in September 2025, and each of the three recorded fewer sales than a year earlier.
Ottawa Suburb West had the firmest conditions of all seven submarkets, with a sales-to-new-listings ratio of 40.7% and 3.7 months of inventory. Ottawa Suburb East recorded 4.3 months of inventory, and Ottawa Suburb South recorded 4.4.
Conditions were softer in Ottawa Centre, with a sales-to-new-listings ratio of 27.6% and 6.8 months of inventory. The rural markets were similar: 6.5 months in Ottawa Rural South, 6.3 in Ottawa Rural East and 5.8 in Ottawa Rural West. With only 40 to 88 sales a month in the rural areas, large percentage swings there should be read with caution.
Are Some Buyers Shifting to New Construction?
New construction is a separate market from the resale numbers above, but it may be pulling some demand away. The Greater Ottawa Home Builders' Association reported 464 new-home sales in Ottawa in August, up 9.7% from July and 55.2% from a year earlier, with year-to-date sales up 50.4%.
That jump lines up with expanded HST relief for qualifying new homes. The figures don't prove the rebate caused the increase, but stronger new-home sales alongside weaker resale absorption is a trend worth keeping an eye on.
What Does the September Ottawa Real Estate Market Mean for Buyers?
Buyers have more choice and more negotiating room than in any September in the past decade, measured by months of inventory and the sales-to-new-listings ratio. That's especially true for condos, Ottawa Centre and the rural markets.
Homes are sitting a few days longer and selling a little further below asking than a year ago, which gives buyers more time to compare properties, complete due diligence and negotiate.
Two cautions. Affordability and borrowing costs still limit what many buyers can do, and one month of benchmark decline doesn't mean prices will keep falling. Waiting for a bottom is a guess, not a strategy. Well-priced single-family homes in stronger submarkets like Ottawa Suburb West can still move quickly.
What Does the September Ottawa Real Estate Market Mean for Sellers?
Sellers are competing with about three new listings for every home that sells. Your real competition isn't what a neighbour got last spring, it's the homes buyers are touring this week.
That makes pricing to current conditions, strong presentation and a clear read on competing listings more important than they've been all year. Condo sellers face the most competition, with 7.3 months of apartment inventory citywide.
If the usual seasonal pattern holds, new listings will decline through October and November. New listings have dropped in both months in each of the past 10 years, which could mean less competition for sellers who list later this fall.
Is Ottawa Becoming a Buyer's Market?
In some segments, yes. Condos, downtown and the rural markets are clearly tilted toward buyers. Citywide, September was the most buyer-friendly September in a decade by both months of inventory and the sales-to-new-listings ratio.
Suburban single-family homes and townhomes are still closer to balanced, which is why the citywide numbers only tell part of the story.
What to Watch in the Ottawa Fall Real Estate Market
October and November will be an important test. The key questions:
Does absorption recover as listings ease? If the sales-to-new-listings ratio improves, September's surge was likely partly seasonal.
Does months of inventory stay near 4.8?
Does the HPI decline again? If absorption stays weak, inventory stays elevated and the benchmark keeps falling, the case for a broader price adjustment gets stronger.
Outside forecasts point the same general direction. TD Economics expects Ontario's existing-home prices to average 2.6% lower in 2026, then rise just 0.6% in 2027. RBC expects Canada's benchmark price index to fall 2.3% in 2026 before edging up 0.8% in 2027. CMHC expects Ottawa sales to stabilize, but says slower demand growth and more supply are limiting price increases. These forecasts cover different areas and use different price measures, so they aren't directly comparable with Ottawa's monthly numbers.
For now, Ottawa remains a market where property type, neighbourhood and pricing strategy matter more than broad headlines.
If you're thinking about buying or selling in Ottawa this fall, the New Purveyors team can help you understand what's happening in your specific part of the market and build a strategy around current conditions.
Important to note is that these statistics can only be as accurate as there are condos sold in Ottawa. The more condos sold in an area, the more accurate the averages will be.
Want to chat about your options? Fill out the form at the bottom of the page, or text/call us directly at 613-900-5700 or fill out the form at the bottom of the page.
Do you have any questions about how this information affects your investment or looking for more information to make the best decision about your purchase? Let’s chat! Fill out the form on the bottom of the page.