
Every month we take a closer look and drill down the sales data of Ottawa condos from the previous month. Here are the statistics for July 2026 in the top five "downtown" areas - Centretown, Byward Market and Sandy Hill, Little Italy (which includes Lebreton Flats), Hintonburg, and Westboro. The information will be specific to apartment-style condominiums, and only what is sold through the MLS. Also important to note that DOM (Day's On Market) is calculated to include the conditional period, which in Ottawa is roughly 14 days for almost every single transaction.
Ottawa’s housing market remained relatively resilient in July, even as activity shifted into the traditionally quieter summer season. Sales were nearly identical to last year, fewer properties came to market, and pricing stayed largely consistent across the city.
The broader numbers suggest a balanced market, but conditions differ considerably depending on the neighbourhood and type of home.
July Home Sales Remained Stable
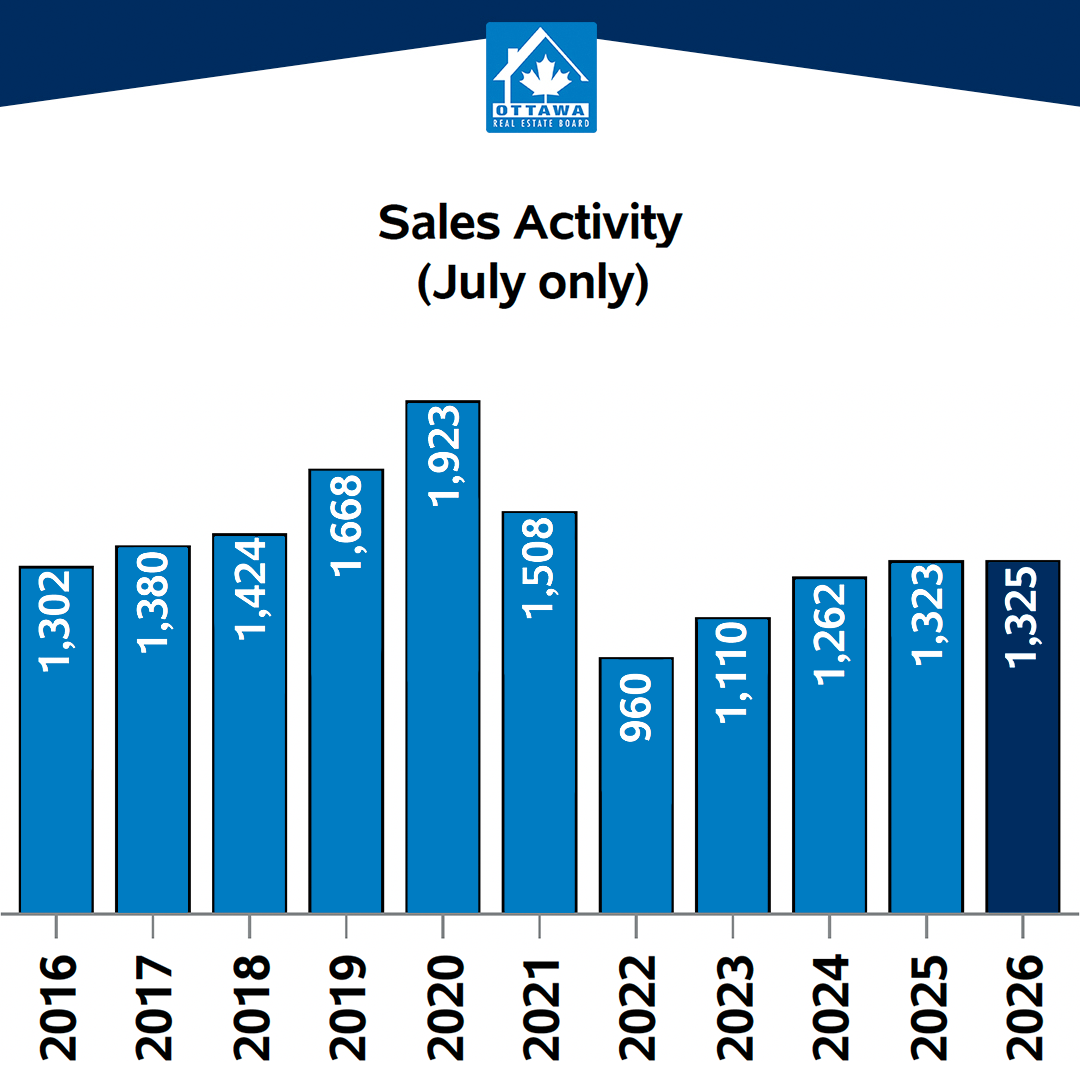
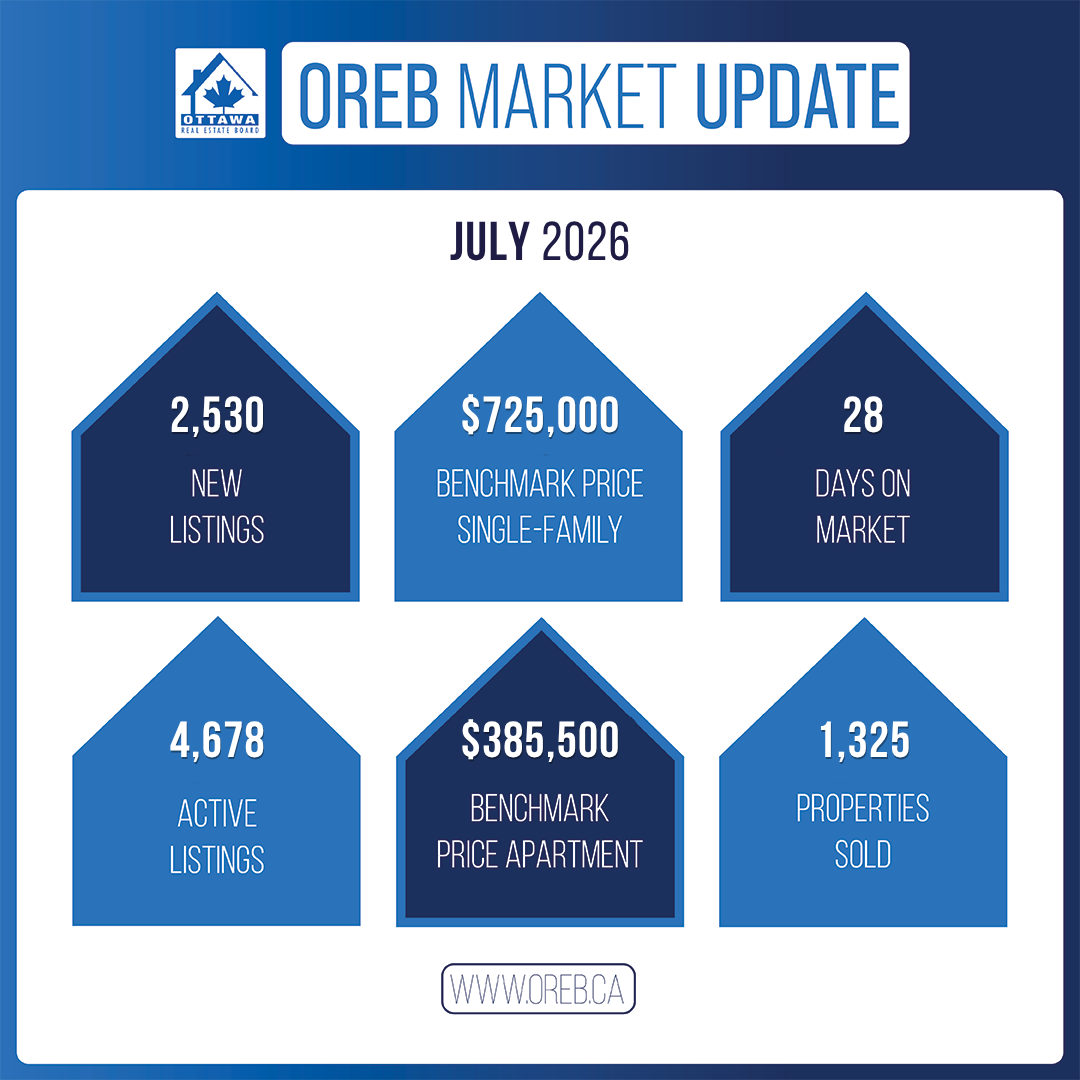
Ottawa recorded 1,325 residential sales through the MLS® System in July, just 0.2% more than in July 2025.
Sales dropped 12.7% from June, but that decline was smaller than the typical June-to-July slowdown seen over the past decade. In other words, Ottawa maintained more of its spring momentum than it normally does at this point in the year.
So far in 2026, 8,288 homes have changed hands, representing a 5.2% decrease compared with the same period last year.
Fewer New Listings Improved the Supply-Demand Balance
A total of 2,530 properties were listed in July, down 0.8% annually. It was the second month out of the last three in which new inventory came in below the previous year’s level.
Because sales held steady while fewer homes entered the market, the sales-to-new-listings ratio rose from 48.8% in June to 52.4% in July.
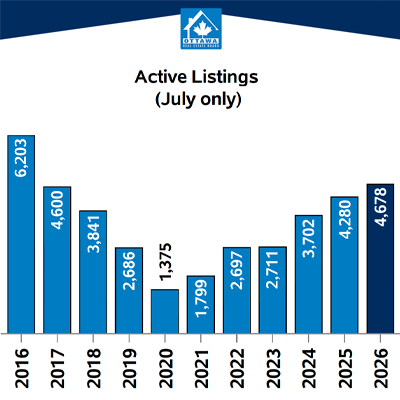
There were 4,678 active listings at the end of the month. That was 9.3% more than one year earlier, but 6.1% fewer than in June. Buyers still have more selection than they did in many recent years, although the rapid expansion of available inventory appears to be slowing.
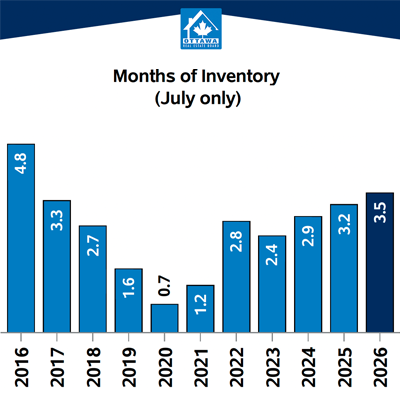
Months of inventory increased slightly from 3.3 to 3.5. While summer usually brings a larger increase, July’s change was relatively modest.
Ottawa Home Prices Were Generally Stable
The average residential sale price reached $683,308, a 1.6% decline from July 2025. However, the median remained unchanged at $635,000.
The MLS® Home Price Index recorded a composite benchmark of $634,000. That figure was 0.5% below last year but 0.3% higher than in June.
Together, these measurements indicate that Ottawa did not experience a widespread drop in property values. The lower average price was likely influenced partly by the combination of homes that sold during the month.
Properties sold for an average of 97.8% of their asking price, compared with 98% last July. The median time required to sell increased from 24 to 28 days.
Market Conditions Varied by Property Type
Detached homes were the strongest of Ottawa’s major housing categories. Sales increased 5% annually to 714 transactions, while the benchmark price rose 0.6%. This segment finished July with 3.2 months of available inventory.
Townhome sales declined 4.1% to 417. Supply conditions improved from June, with 3.0 months of inventory and a sales-to-new-listings ratio of 55.9%. Despite stronger absorption, the townhouse benchmark remained 5.1% below its July 2025 level.
Condominium apartments continued to face the greatest amount of competition, especially in central Ottawa. Apartment sales fell 6.6% to 169 transactions, while the benchmark price declined 5.2% annually. This category recorded 5.4 months of inventory, a 41% sales-to-new-listings ratio and a median selling period of 41 days.
Ottawa’s Suburbs Continued to Outperform the Core
More than 70% of July’s transactions took place in Ottawa’s suburban areas.
The southern suburbs posted an 8% increase in sales while new listings fell 6.6%. The western suburbs recorded the strongest rate of absorption, with a sales-to-new-listings ratio of 56.2%. Eastern suburban communities also remained balanced, with a ratio of 54.3%.
The central market was noticeably softer. Sales in Ottawa Centre decreased 8.3%, months of inventory reached 5.6, and the sales-to-new-listings ratio fell to 39.6%.
Rural results were mixed. Activity increased in the southern and western rural areas but declined in the east. These smaller markets can experience large percentage changes from only a handful of additional or fewer transactions.
What Could Shape the Fall Market?
The economic picture has become somewhat steadier than it appeared earlier in the spring. Statistics Canada reported modest GDP growth in May, and the Bank of Canada maintained its policy rate at 2.25% in July.
Stable borrowing rates and continued economic growth could support housing demand, although uncertainty has not disappeared.
Heading into the fall, the biggest indicators to watch will be the number of new properties coming to market, whether active inventory continues to decline and whether condo demand begins to strengthen. Ottawa’s overall statistics point to balance, but buyers and sellers should rely on neighbourhood- and property-specific data when making decisions.
Important to note is that these statistics can only be as accurate as there are condos sold in Ottawa. The more condos sold in an area, the more accurate the averages will be.
Want to chat about your options? Fill out the form at the bottom of the page, or text/call us directly at 613-900-5700 or fill out the form at the bottom of the page.
Do you have any questions about how this information affects your investment or looking for more information to make the best decision about your purchase? Let’s chat! Fill out the form on the bottom of the page.