
Every month we take a closer look and drill down the sales data of Ottawa condos from the previous month. Here are the statistics for August 2026 in the top five "downtown" areas - Centretown, Byward Market and Sandy Hill, Little Italy (which includes Lebreton Flats), Hintonburg, and Westboro. The information will be specific to apartment-style condominiums, and only what is sold through the MLS. Also important to note that DOM (Day's On Market) is calculated to include the conditional period, which in Ottawa is roughly 14 days for almost every single transaction.
Ottawa’s housing market slowed considerably in August, with sales falling much more sharply than is typical for the end of summer.
At the same time, home prices remained relatively steady. That combination created a market with more breathing room for buyers, more competition for sellers, and a noticeable increase in available inventory relative to the pace of sales.
The key question heading into the fall market is whether August was simply an unusually quiet month or the beginning of a more sustained slowdown in Ottawa real estate.
Ottawa Home Sales Dropped Sharply in August
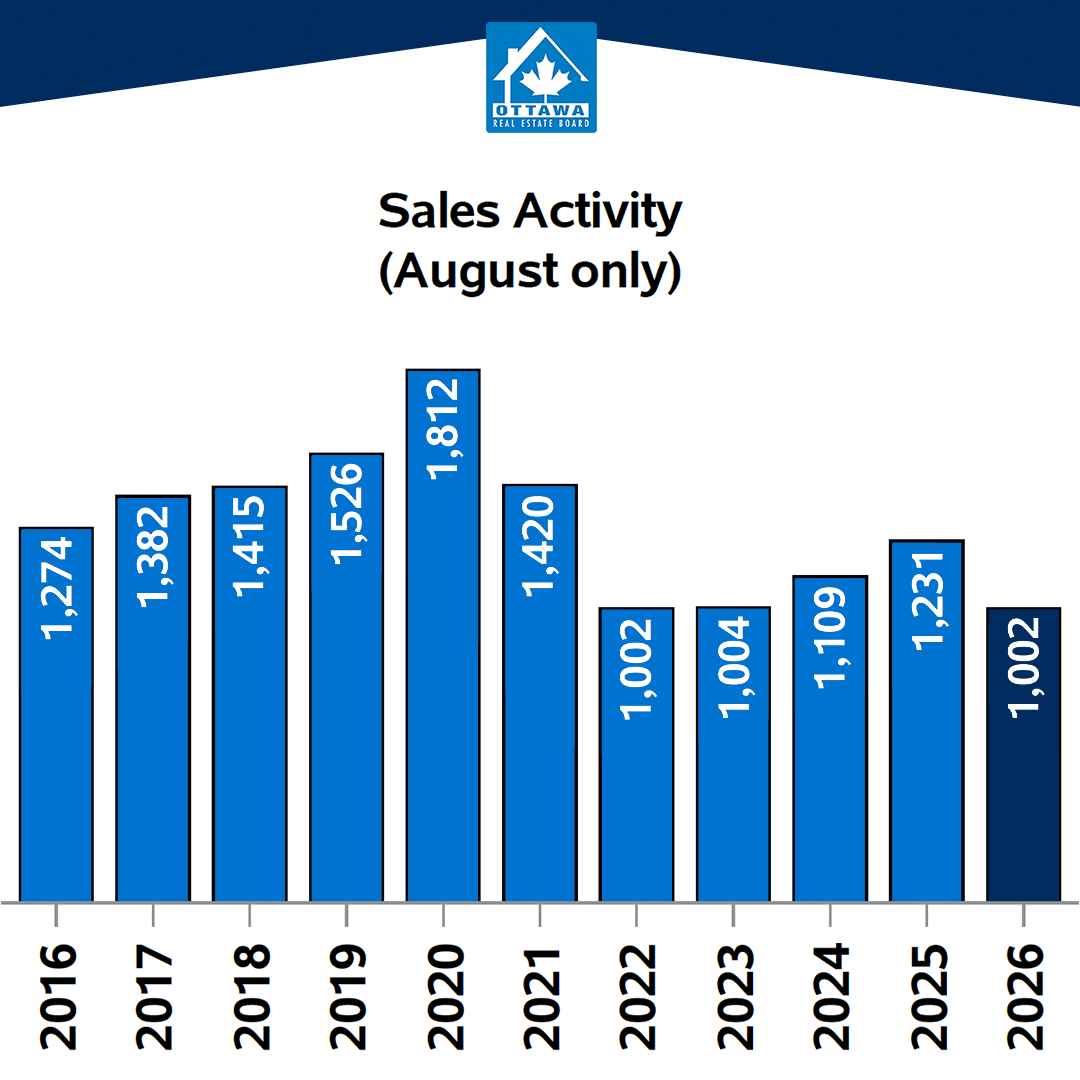
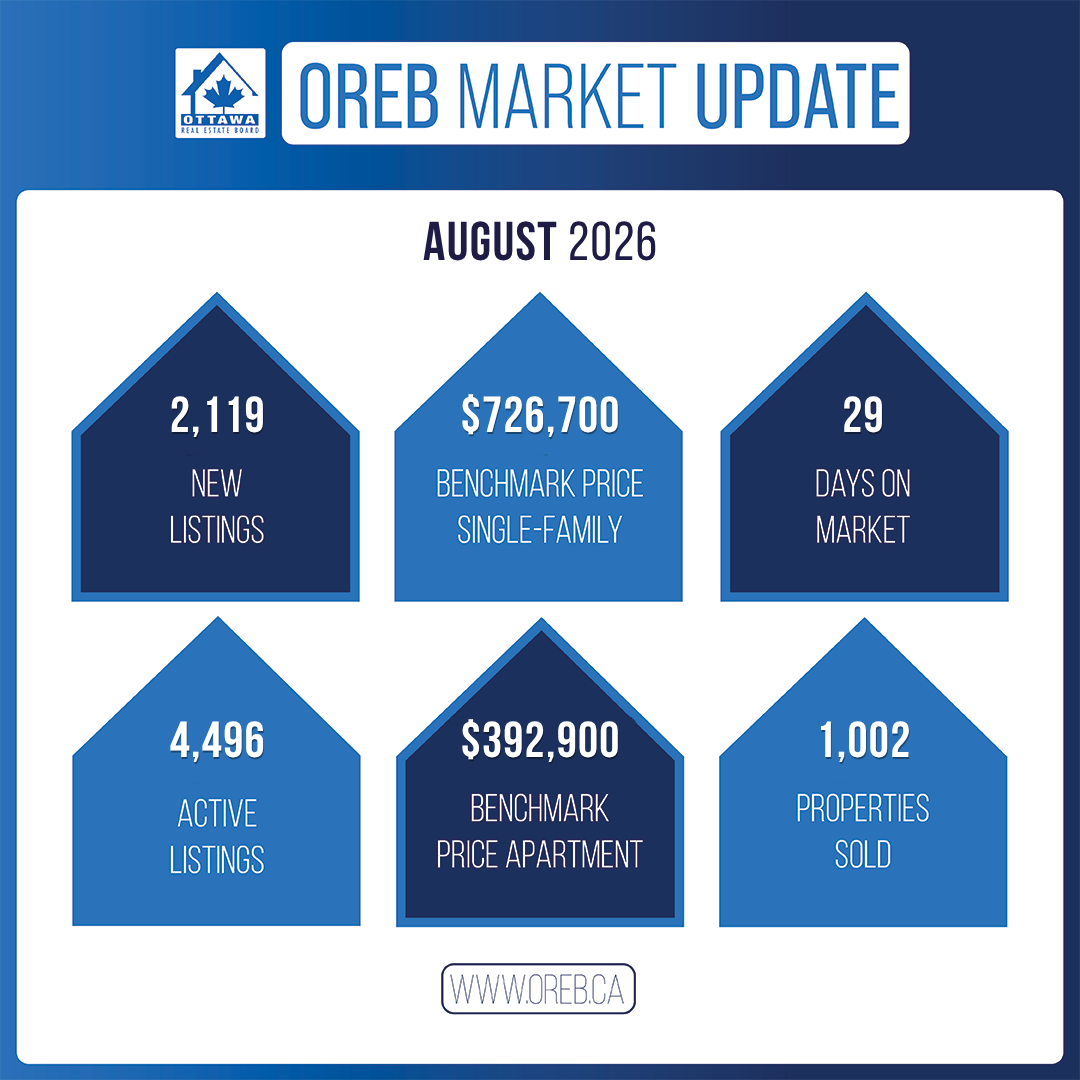
A total of 1,002 homes sold through the Ottawa MLS® System in August 2026, down 18.6% from August 2025.
Sales were also down 24.4% from July. That is particularly notable because the median July-to-August decline over the previous 10 years was only 5.8%. August 2026 therefore represented a much larger slowdown than normal seasonal activity.
The slowdown was also broad-based across Ottawa’s major property types:
Single-family homes: 535 sales, down 16.3% year over year
Townhomes: 310 sales, down 19.9%
Apartments: 136 sales, down 22.3%
Earlier in 2026, weaker activity had been more concentrated in townhomes and apartments. August was different because all three major segments experienced meaningful declines.
Year to date, 9,283 homes have sold in Ottawa, down 6.9% from the same period in 2025.
Ottawa Home Prices Remained Relatively Stable
Despite the sharp decline in sales, Ottawa home prices did not experience the same level of movement.
The average residential sale price was $688,253 in August, up 0.3% from a year earlier and 0.7% from July.
The median sale price was $622,357, down 1.2% year over year and 2.0% from July.
The MLS® Home Price Index recorded a composite benchmark price of $637,700, up 1.0% from August 2025 and 0.6% from July.
These numbers are an important reminder that declining sales do not automatically mean rapidly declining home values.
In August, transaction activity weakened considerably while pricing remained comparatively steady.
Ottawa Housing Inventory Reached Its Highest August Level Since 2016
There were 2,119 new listings in Ottawa during August, unchanged from a year earlier and down 16.2% from July.
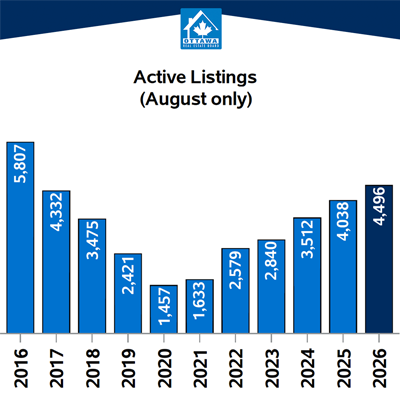
Active listings totalled 4,496, up 11.3% year over year. While active inventory declined slightly from July, it remained at its highest level for the month of August since 2016.
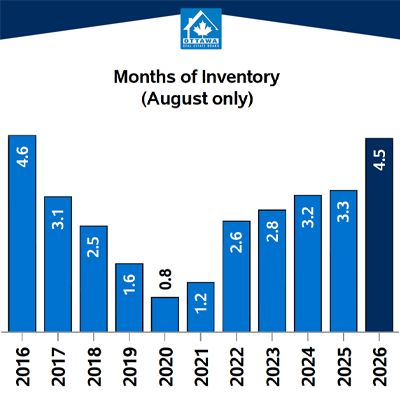
The more significant change was in months of inventory, which increased from 3.5 months in July to 4.5 months in August.
Over the previous decade, the median July-to-August change in months of inventory was zero. No increase during that period exceeded 0.4 months, making this year’s one-month increase particularly notable.
The sales-to-new-listings ratio also fell from 52.4% in July to 47.3% in August, another sign that available supply was not being absorbed as quickly.
Homes Are Taking Slightly Longer to Sell
The median time on market increased to 29 days, compared with 28 days in August 2025.
Homes sold for an average of 97.9% of their listing price, unchanged from last year.
These numbers still point to broadly balanced conditions, but sellers are generally competing for fewer active buyers than they were earlier in the year.
That makes pricing, presentation and understanding direct competition especially important heading into the fall market.
Single-Family Homes Remain Ottawa’s Most Stable Segment
Single-family homes continued to show the strongest relative stability among Ottawa’s major housing types.
The single-family benchmark price increased 2.2% year over year, while months of inventory reached 4.0.
Detached homes are not immune to the broader slowdown, but pricing has held up better than in other segments.
For buyers, this means attractive detached homes in desirable Ottawa neighbourhoods may still see meaningful competition even when broader citywide statistics appear softer.
Ottawa Townhome Market Is Showing More Pressure
Townhomes experienced another softer month in August.
There were 4.1 months of townhome inventory, while active listings were 27.1% higher than a year earlier.
The townhome benchmark price was also 4.0% lower year over year.
This is becoming an important segment to watch.
Buyers looking for Ottawa townhomes currently have more options than they did in lower-inventory markets, while sellers need to pay close attention to competing listings and recent comparable sales.
Ottawa Condo and Apartment Market Remains the Softest Segment
Apartment-style properties continued to have the softest market conditions in Ottawa.
Apartments recorded 6.3 months of inventory, a 43.0% sales-to-new-listings ratio, and a median of 42 days on market in August.
There were, however, a few signs of stabilization within the segment. Active apartment listings declined from July, the sales-to-new-listings ratio improved slightly, and the apartment benchmark price increased 1.9% month over month.
So while Ottawa condos remain more buyer-friendly than detached homes, August did not necessarily represent a significant new deterioration in the condo market.
Which Parts of Ottawa Were Strongest in August?
Ottawa’s suburban markets continued to account for more than 70% of residential sales.
However, all three major suburban areas recorded lower sales than a year earlier:
Ottawa Suburb West: down 14.3%
Ottawa Suburb East: down 20.0%
Ottawa Suburb South: down 25.1%
Ottawa Suburb West showed the strongest absorption of the three, with a sales-to-new-listings ratio of 51.9% and 3.6 months of inventory.
Conditions were softer in Ottawa Centre, which recorded 7.0 months of inventory, and Ottawa Rural East, which recorded 6.5 months.
This is another reason citywide averages only tell part of the story. Buyers and sellers may experience very different conditions depending on the neighbourhood, property type and price range they are working within.
What Does the August Ottawa Real Estate Market Mean for Buyers?
For buyers, August created more room to make thoughtful decisions.
Higher inventory and slower sales can mean more time to compare properties, revisit listings, complete due diligence and negotiate without the pressure that often comes with a rapidly moving market.
That does not mean every Ottawa home will be negotiable.
Well-priced detached homes in sought-after neighbourhoods can still attract strong interest. But townhome and condo buyers, in particular, may find more options and more negotiating leverage than they would have had in tighter markets.
What Does the August Ottawa Real Estate Market Mean for Sellers?
For sellers, the market is becoming less forgiving.
There are more listings competing for attention while fewer homes are changing hands.
That means sellers need to understand what buyers are comparing their home against right now, not simply what a neighbour sold for several months ago.
Pricing too aggressively can lead to longer days on market, while strong presentation and realistic positioning can help a property stand out in a market where buyers have more alternatives.
Is Ottawa Becoming a Buyer’s Market?
Not necessarily.
Ottawa still shows many characteristics of a balanced market, but conditions weakened noticeably in August.
A 47.3% sales-to-new-listings ratio and 4.5 months of inventory point to a market that is giving buyers more choice, without yet suggesting a dramatic citywide shift.
The bigger story is the difference between market segments.
Detached homes remain comparatively stable. Townhomes are showing more pressure. Apartment-style properties continue to offer the greatest supply relative to demand.
What to Watch in the Ottawa Fall Real Estate Market
August was only one month, so it is too early to determine whether the slowdown represents a longer-term trend.
The fall market should provide more clarity.
The biggest indicators to watch will be whether sales recover in September, whether months of inventory remain elevated, whether sellers who removed listings over the summer return to the market, and whether pricing continues to hold despite softer sales activity.
For now, Ottawa remains a market where property type, neighbourhood and pricing strategy matter more than broad headlines.
If you are thinking about buying or selling a home in Ottawa this fall, the New Purveyors team can help you understand what is happening in your specific part of the market and build a strategy around current conditions.
Important to note is that these statistics can only be as accurate as there are condos sold in Ottawa. The more condos sold in an area, the more accurate the averages will be.
Want to chat about your options? Fill out the form at the bottom of the page, or text/call us directly at 613-900-5700 or fill out the form at the bottom of the page.
Do you have any questions about how this information affects your investment or looking for more information to make the best decision about your purchase? Let’s chat! Fill out the form on the bottom of the page.