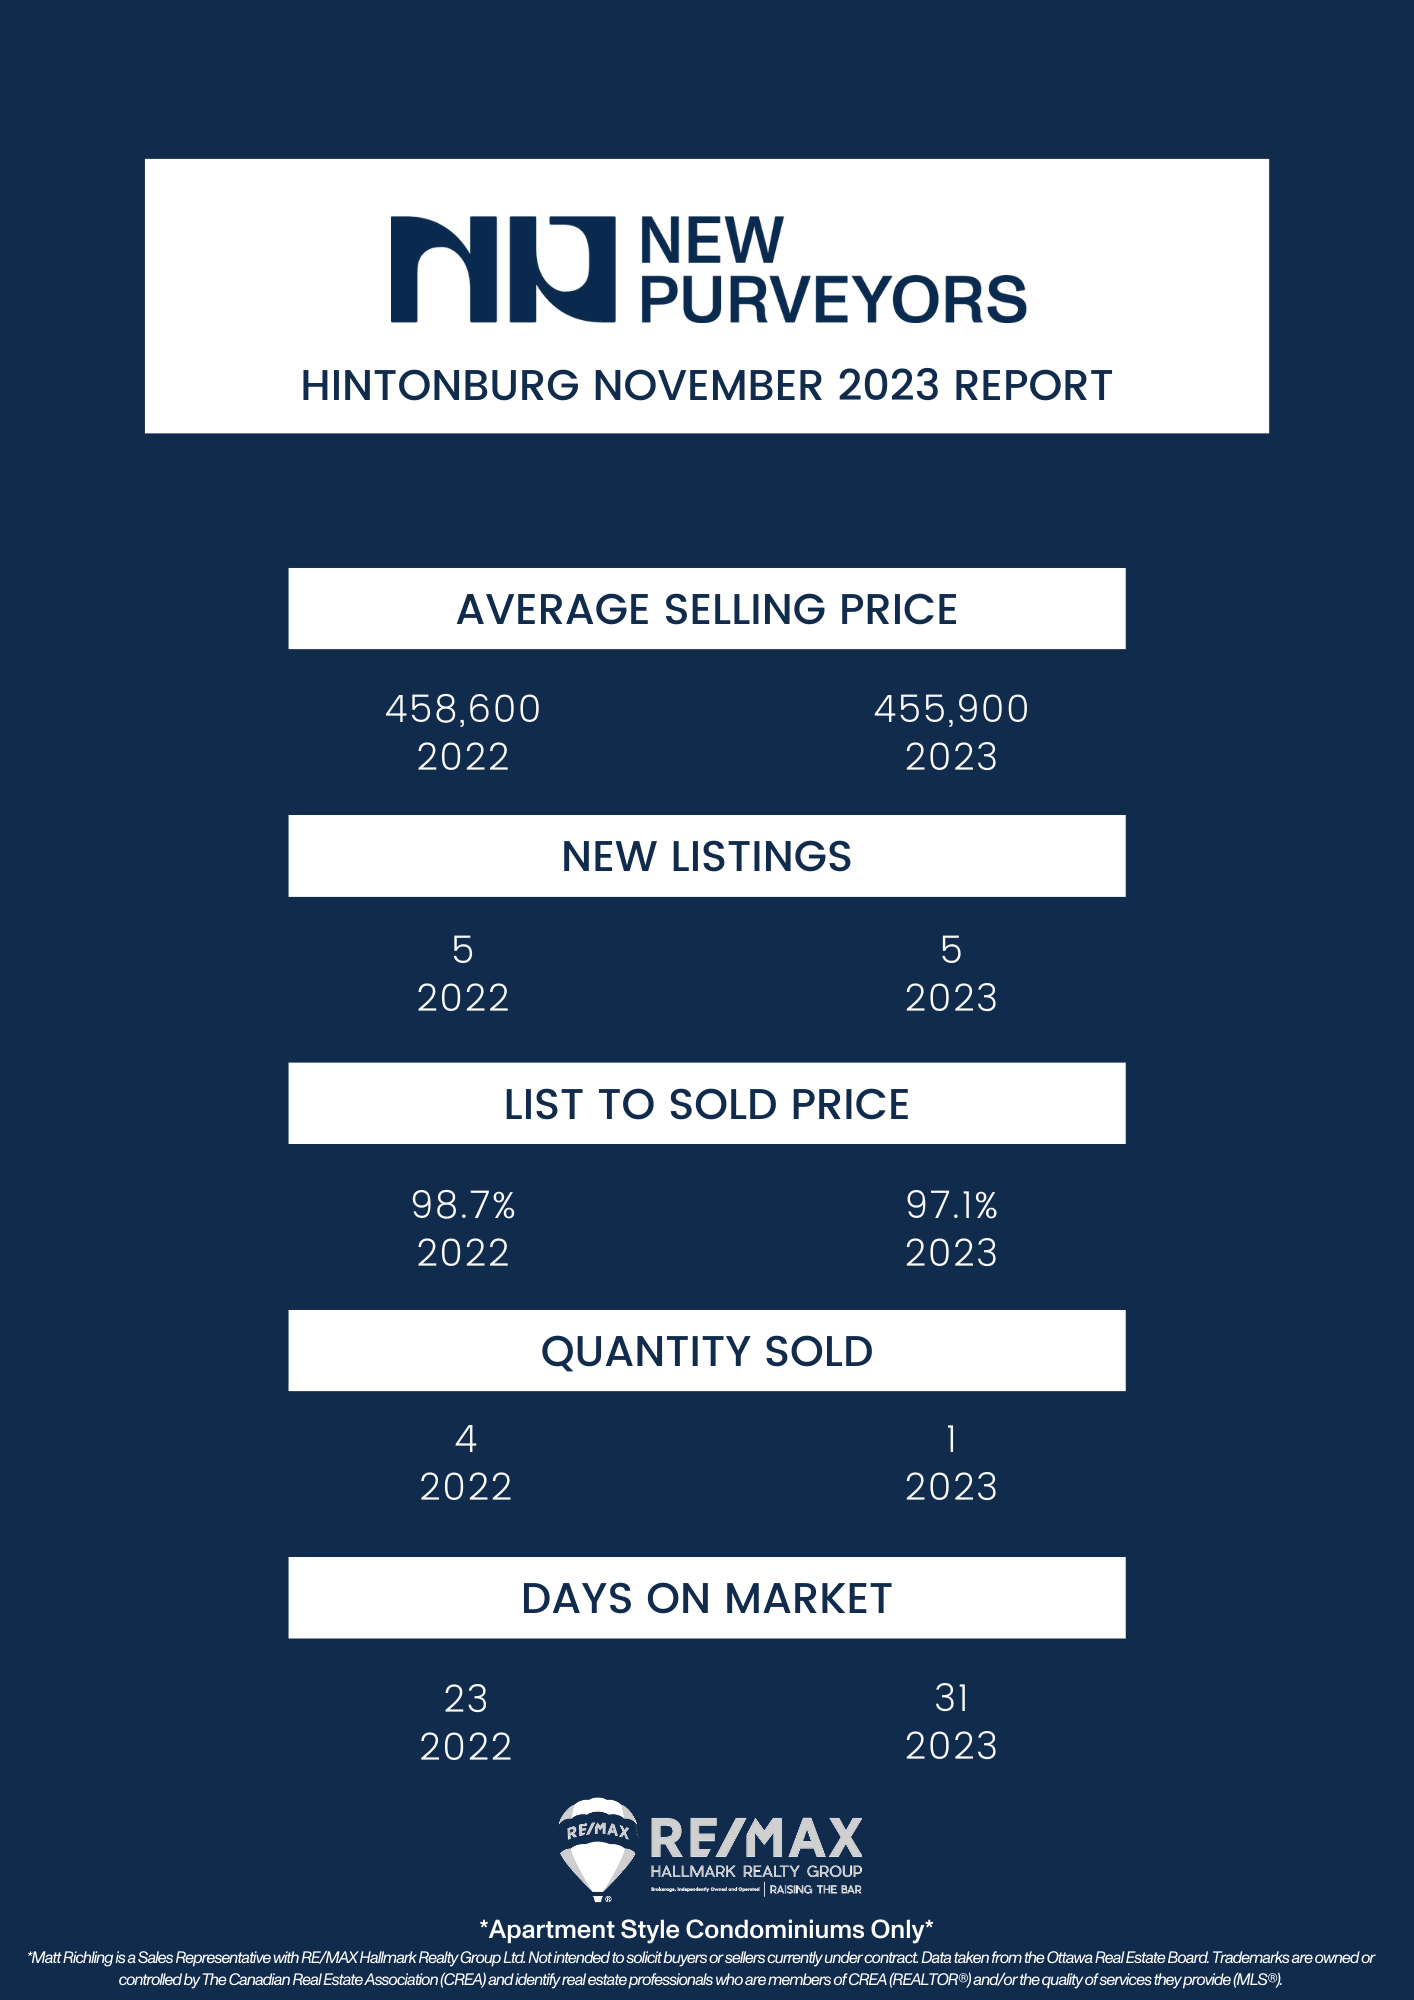
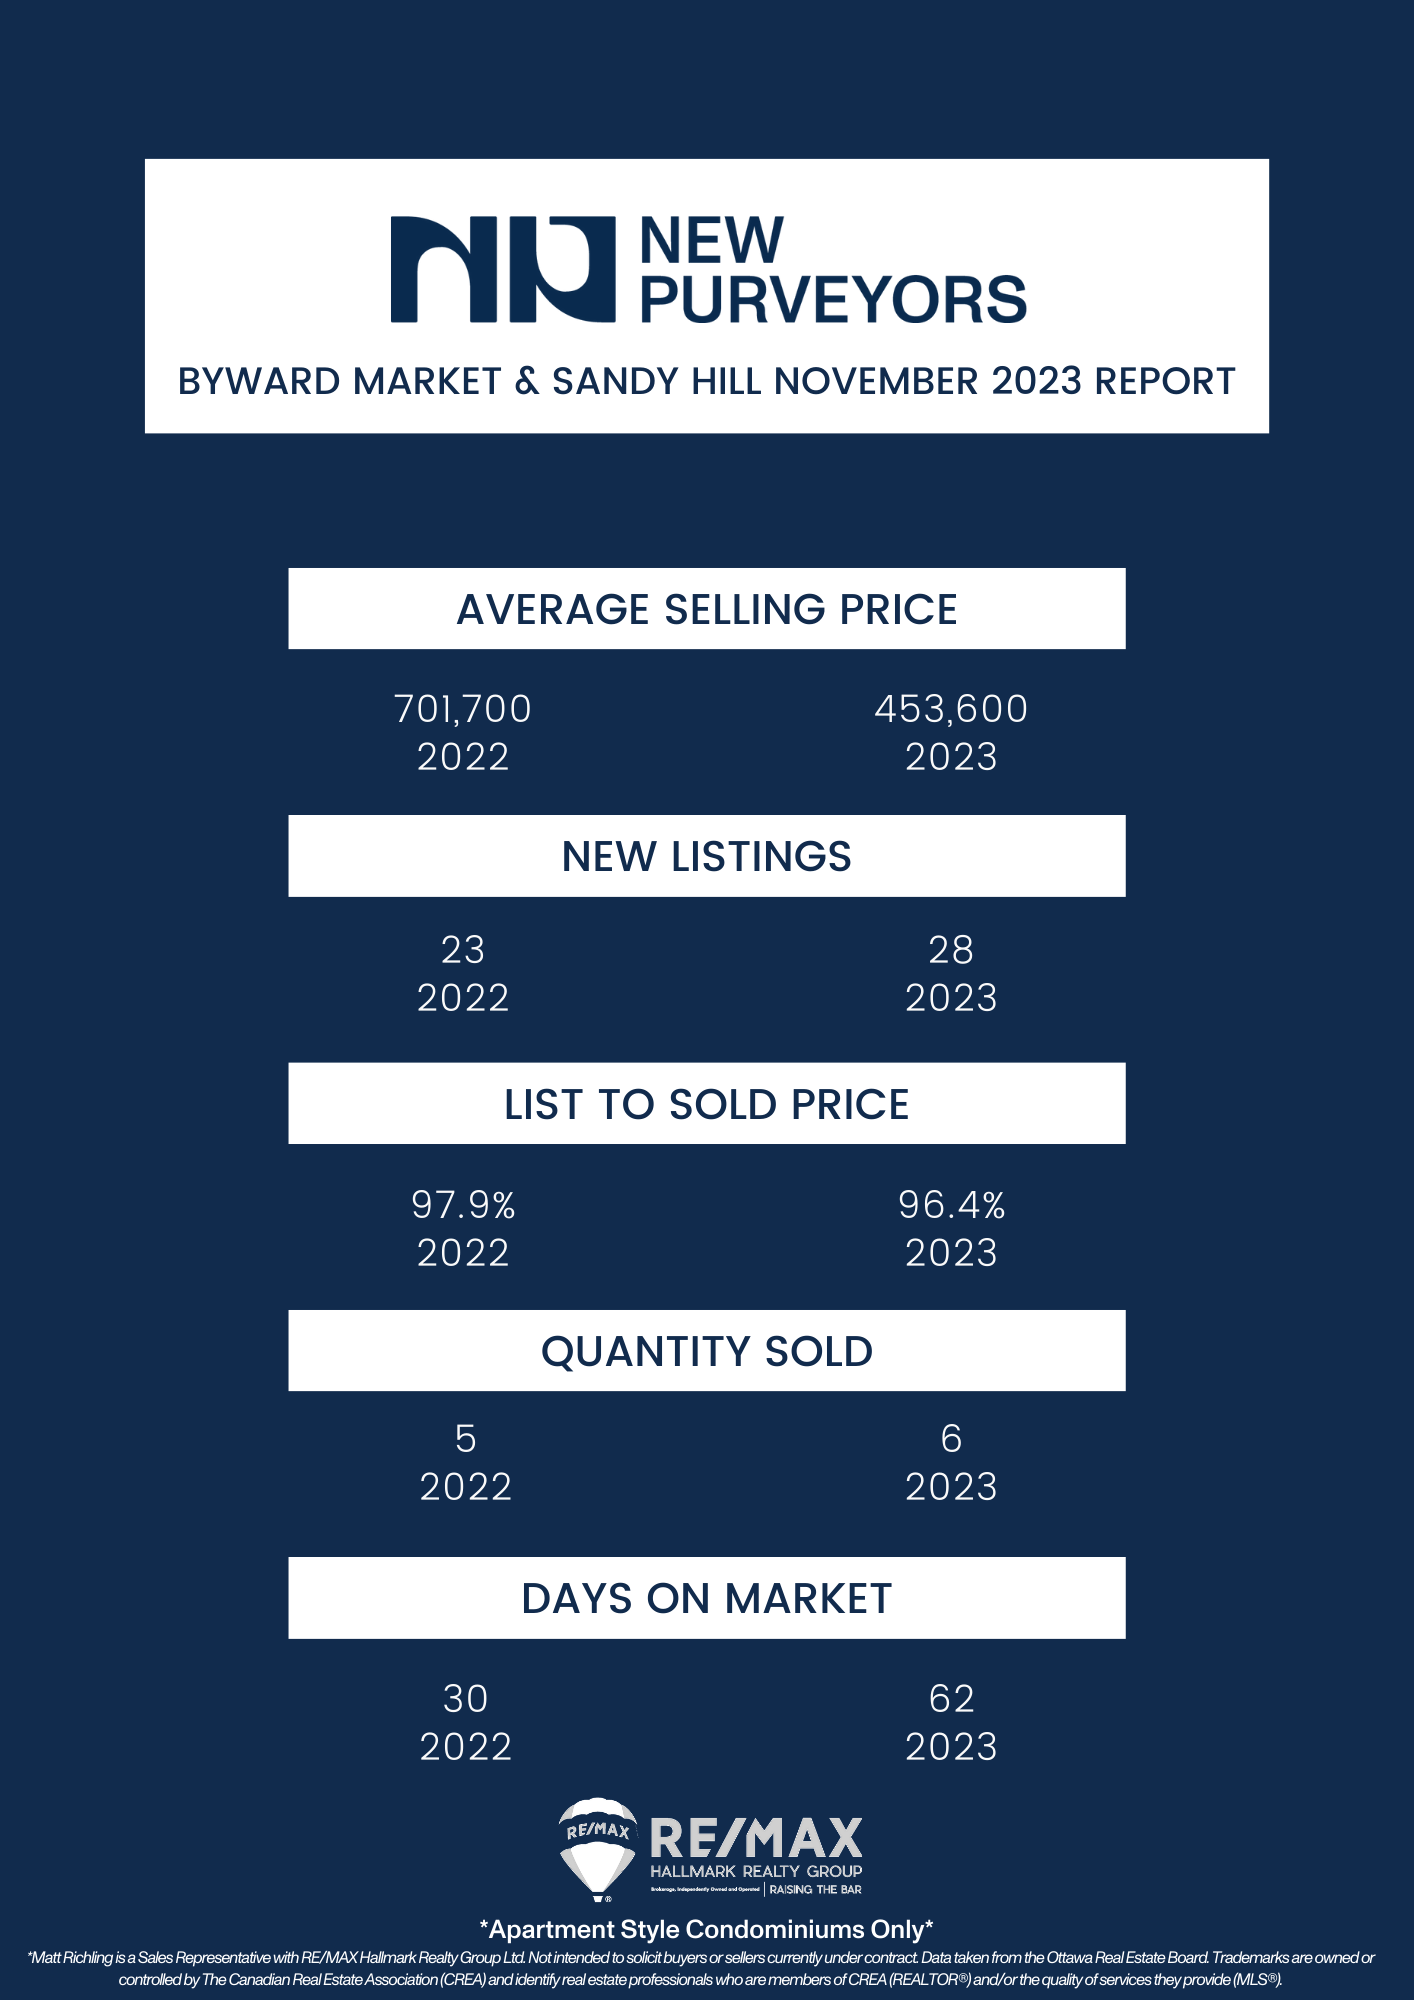
Every month we take a closer look and drill down the sales data of Ottawa condos from the previous month. Here are the statistics for November 2023 in the top five "downtown" areas - Centretown, Byward Market and Sandy Hill, Little Italy (which includes Lebreton Flats), Hintonburg, and Westboro. The information will be specific to apartment-style condominiums, and only what is sold through the MLS. Also important to note that DOM (Day's On Market) is calculated to include the conditional period, which in Ottawa is roughly 14 days for almost every single transaction.
In November 2023, a total of 724 homes were sold through the MLS® System of the Ottawa Real Estate Board, marking a slight decrease of 1.6% compared to November 2022. Home sales for the month were 31.8% below the five-year average and 27.4% below the 10-year average.
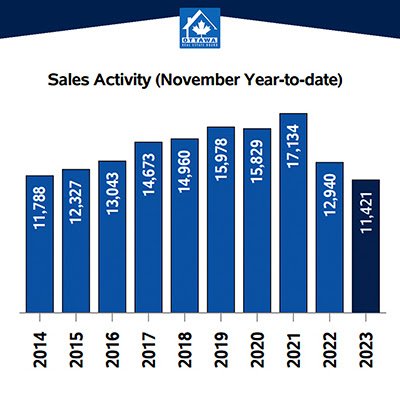
On a year-to-date basis, home sales amounted to 11,421 units after 11 months, indicating a significant decline of 11.7% compared to the same period in 2022.
OREB President Ken Dekker noted that sales are in line with expectations for the colder months. An increase in new and active listings is providing more choices in the market. Although this has slowed the pace of buying and selling, prospective buyers and those looking to upgrade can collaborate with their REALTOR® to carefully explore the market, identify ideal properties, and negotiate attractive deals at their own pace. Sellers, on the other hand, need to manage their expectations regarding the quantity of offers and transaction speed, relying on their REALTOR® for guidance on pricing and preparing their homes for a quality sale.
Turning to prices, the MLS® Home Price Index (HPI) serves as a more accurate measure of price trends than average or median price measures. The overall MLS® HPI composite benchmark price remained nearly unchanged at $628,900 in November 2023, reflecting a modest increase of 1.4% from November 2022. Single-family homes saw a benchmark price of $708,900, up 1.6% year-over-year, while townhouses and apartments had benchmark prices of $492,300 and $424,300, respectively.
The average price of homes sold in November 2023 was $633,138, a decrease of 0.8% from November 2022. The year-to-date average price was $669,536, representing a decline of 5.7% from the same period in 2022. The total dollar value of home sales in November 2023 was $458.4 million, down 2.4% from the same month in 2022.
OREB emphasizes that the average sale price can indicate trends over time but should not be relied upon to assess specific property values. Price variations exist between neighbourhoods.
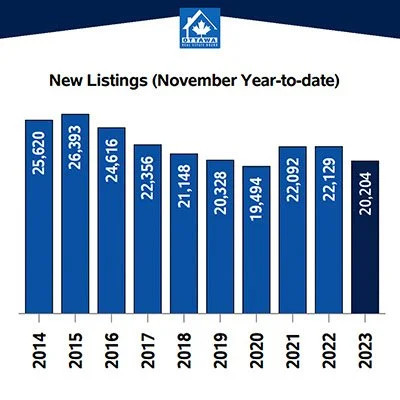
In terms of inventory and new listings, there was a 2.7% increase in new listings in November 2023, totalling 1,428. This figure was 8.4% above the five-year average and 10.4% above the 10-year average for November. Active residential listings at the end of November numbered 2,752, showing a substantial gain of 15.8% from November 2022. Active listings were 53.9% above the five-year average and 6.7% below the 10-year average for November, reaching a level not seen in over five years.
The months of inventory stood at 3.8 at the end of November 2023, up from 3.2 in November 2022 and surpassing the long-run average of 3.3 months for this time of year. Months of inventory represent the number of months it would take to sell current inventories at the current rate of sales activity.

Important to note is that these statistics can only be as accurate as there are condos sold in Ottawa. The more condos sold in an area, the more accurate the averages will be.
Want to chat about your options? Fill out the form at the bottom of the page, or text/call us directly 613-900-5700 or fill out the form at the bottom of the page.
Do you have any questions about how this information affects your investment or looking for more information to make the best decision about your purchase? Let’s chat! Fill out the form on the bottom of the page.