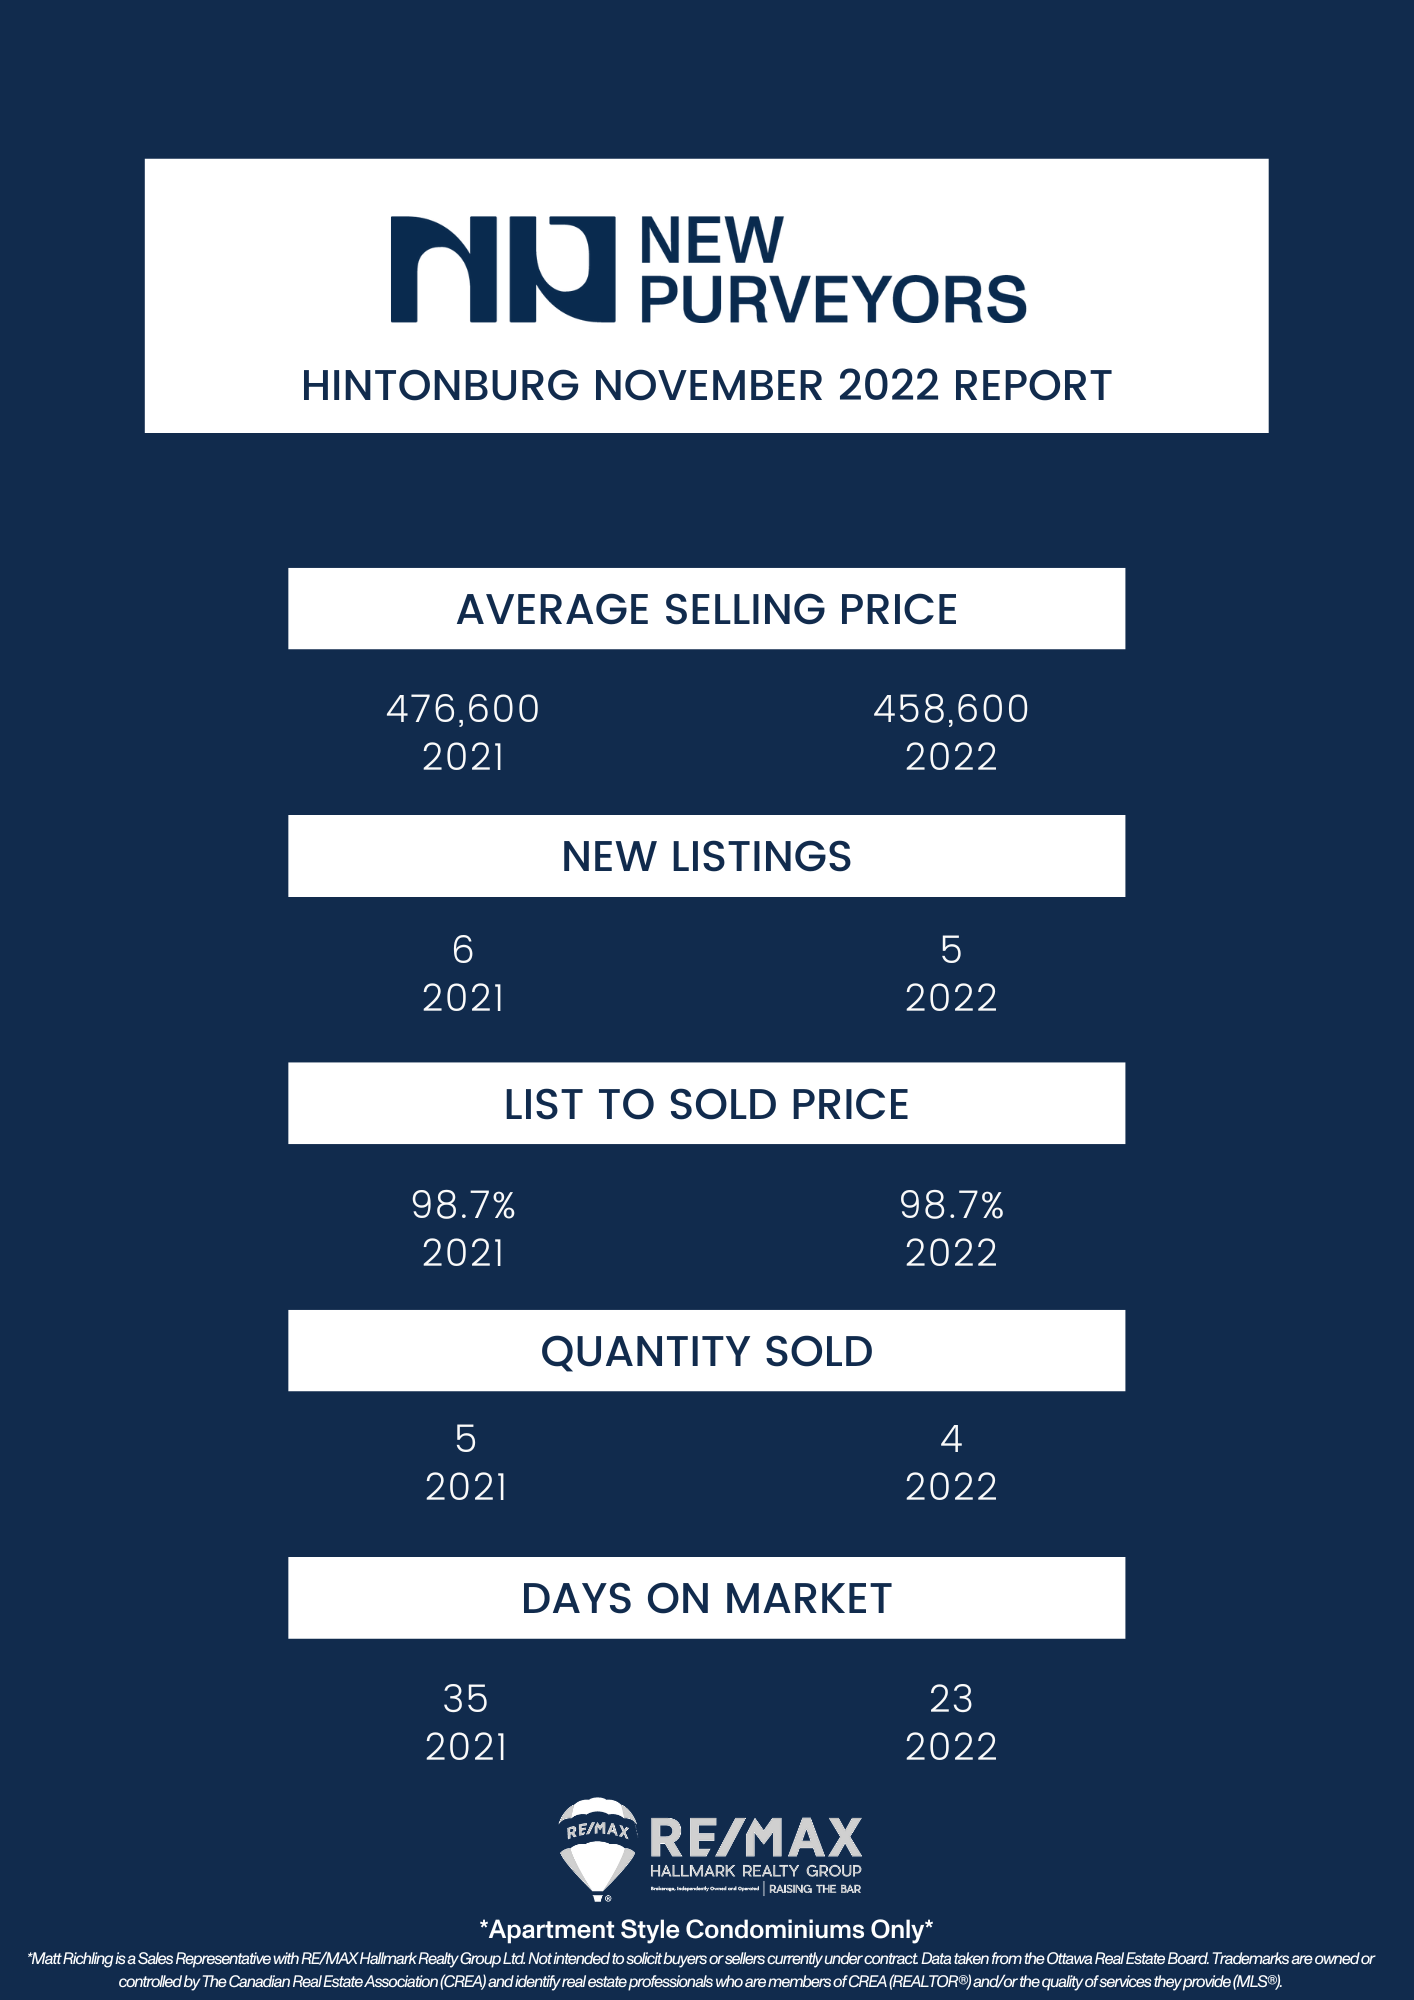
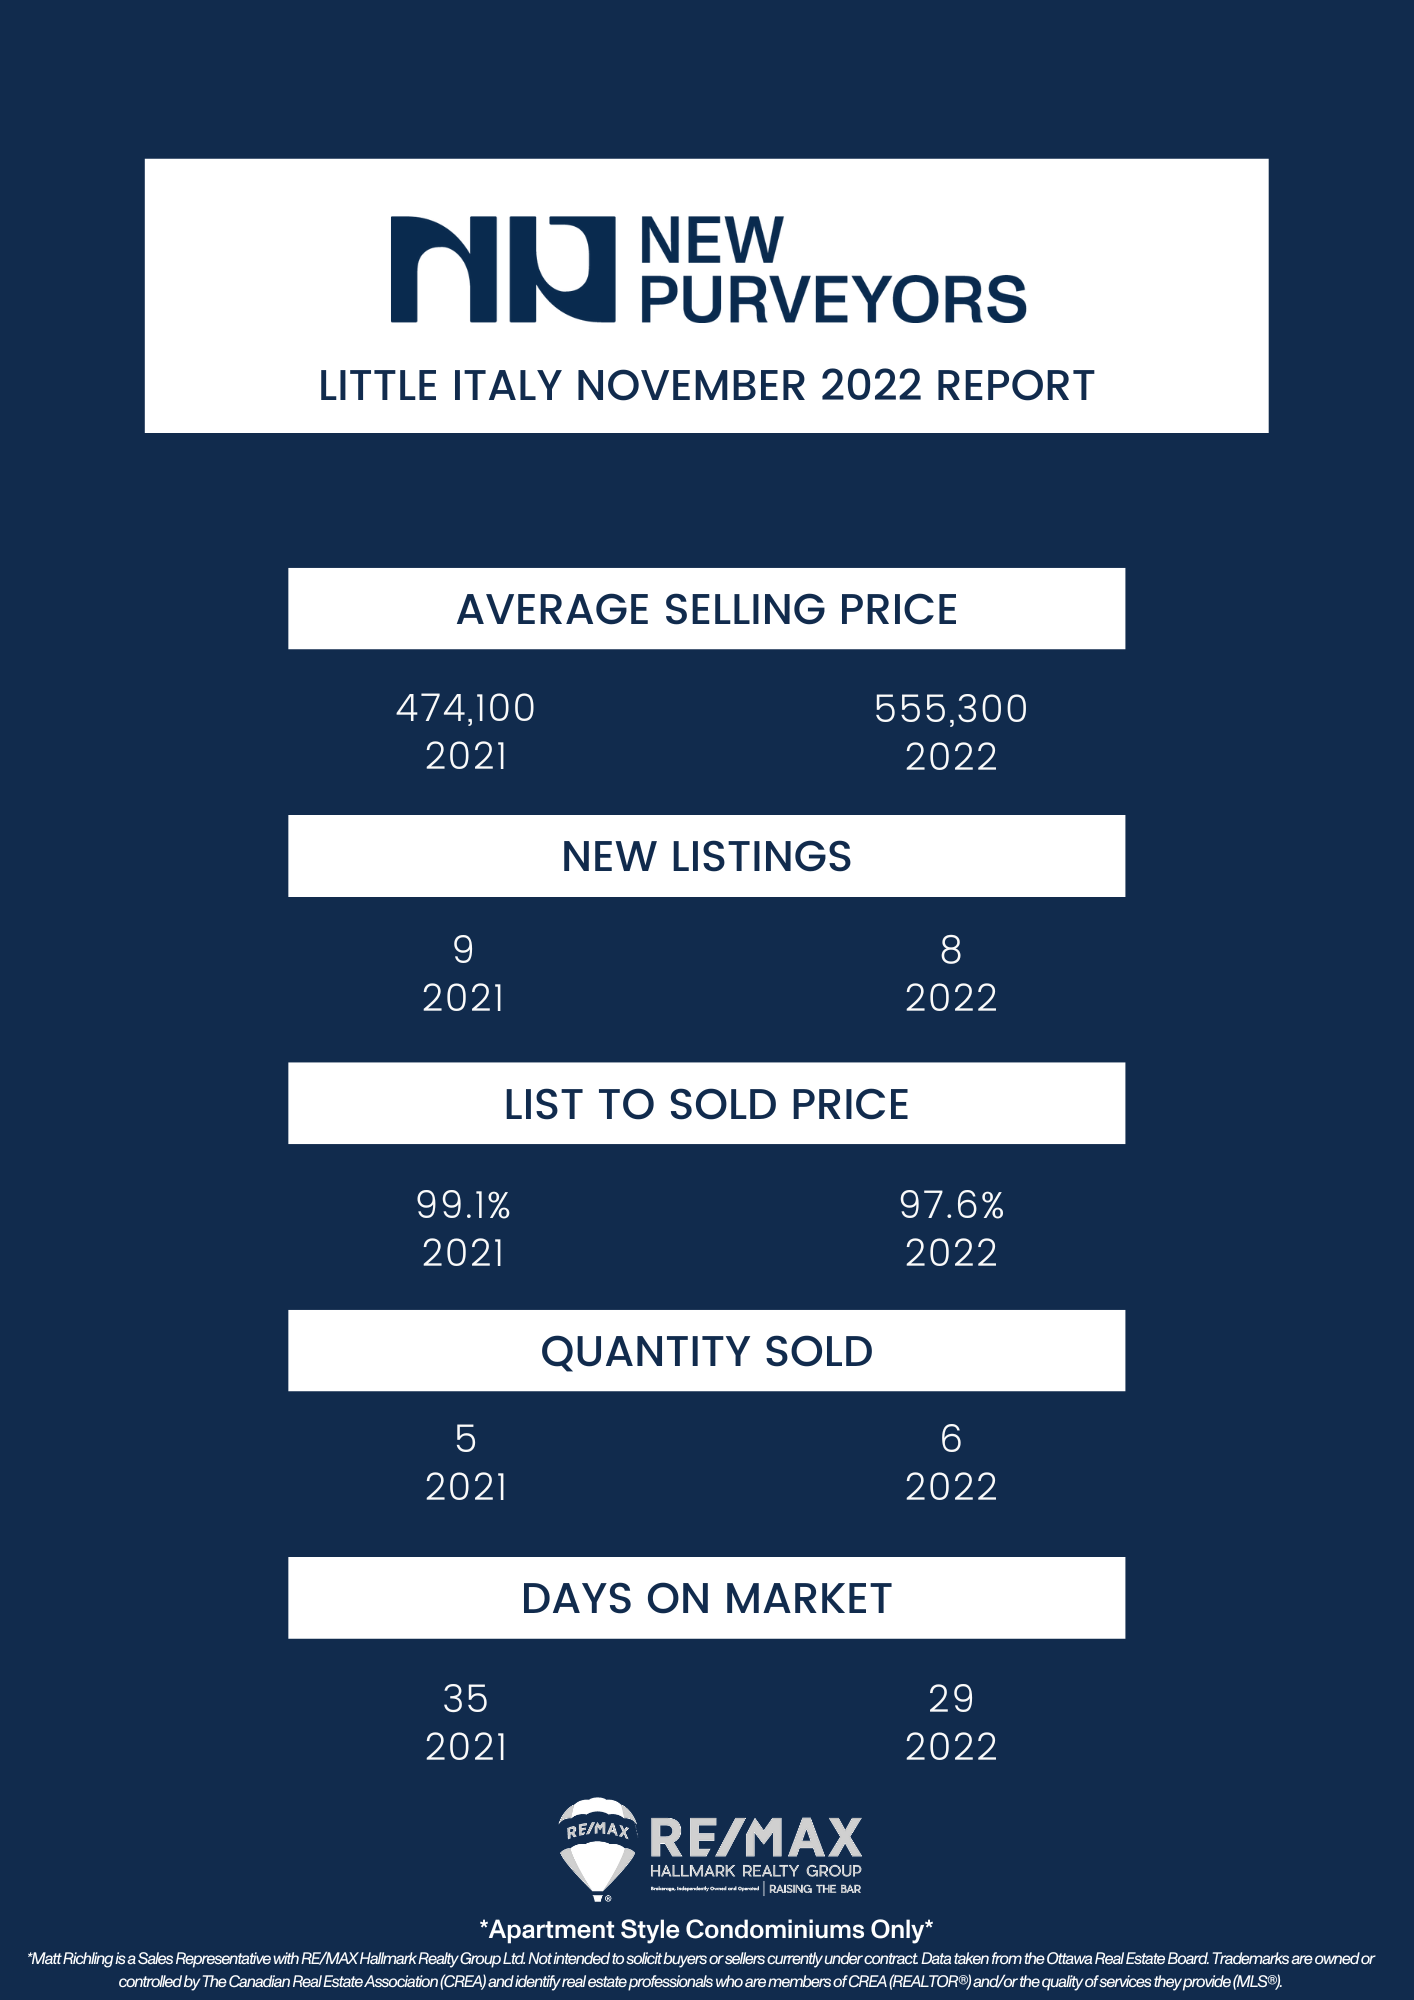
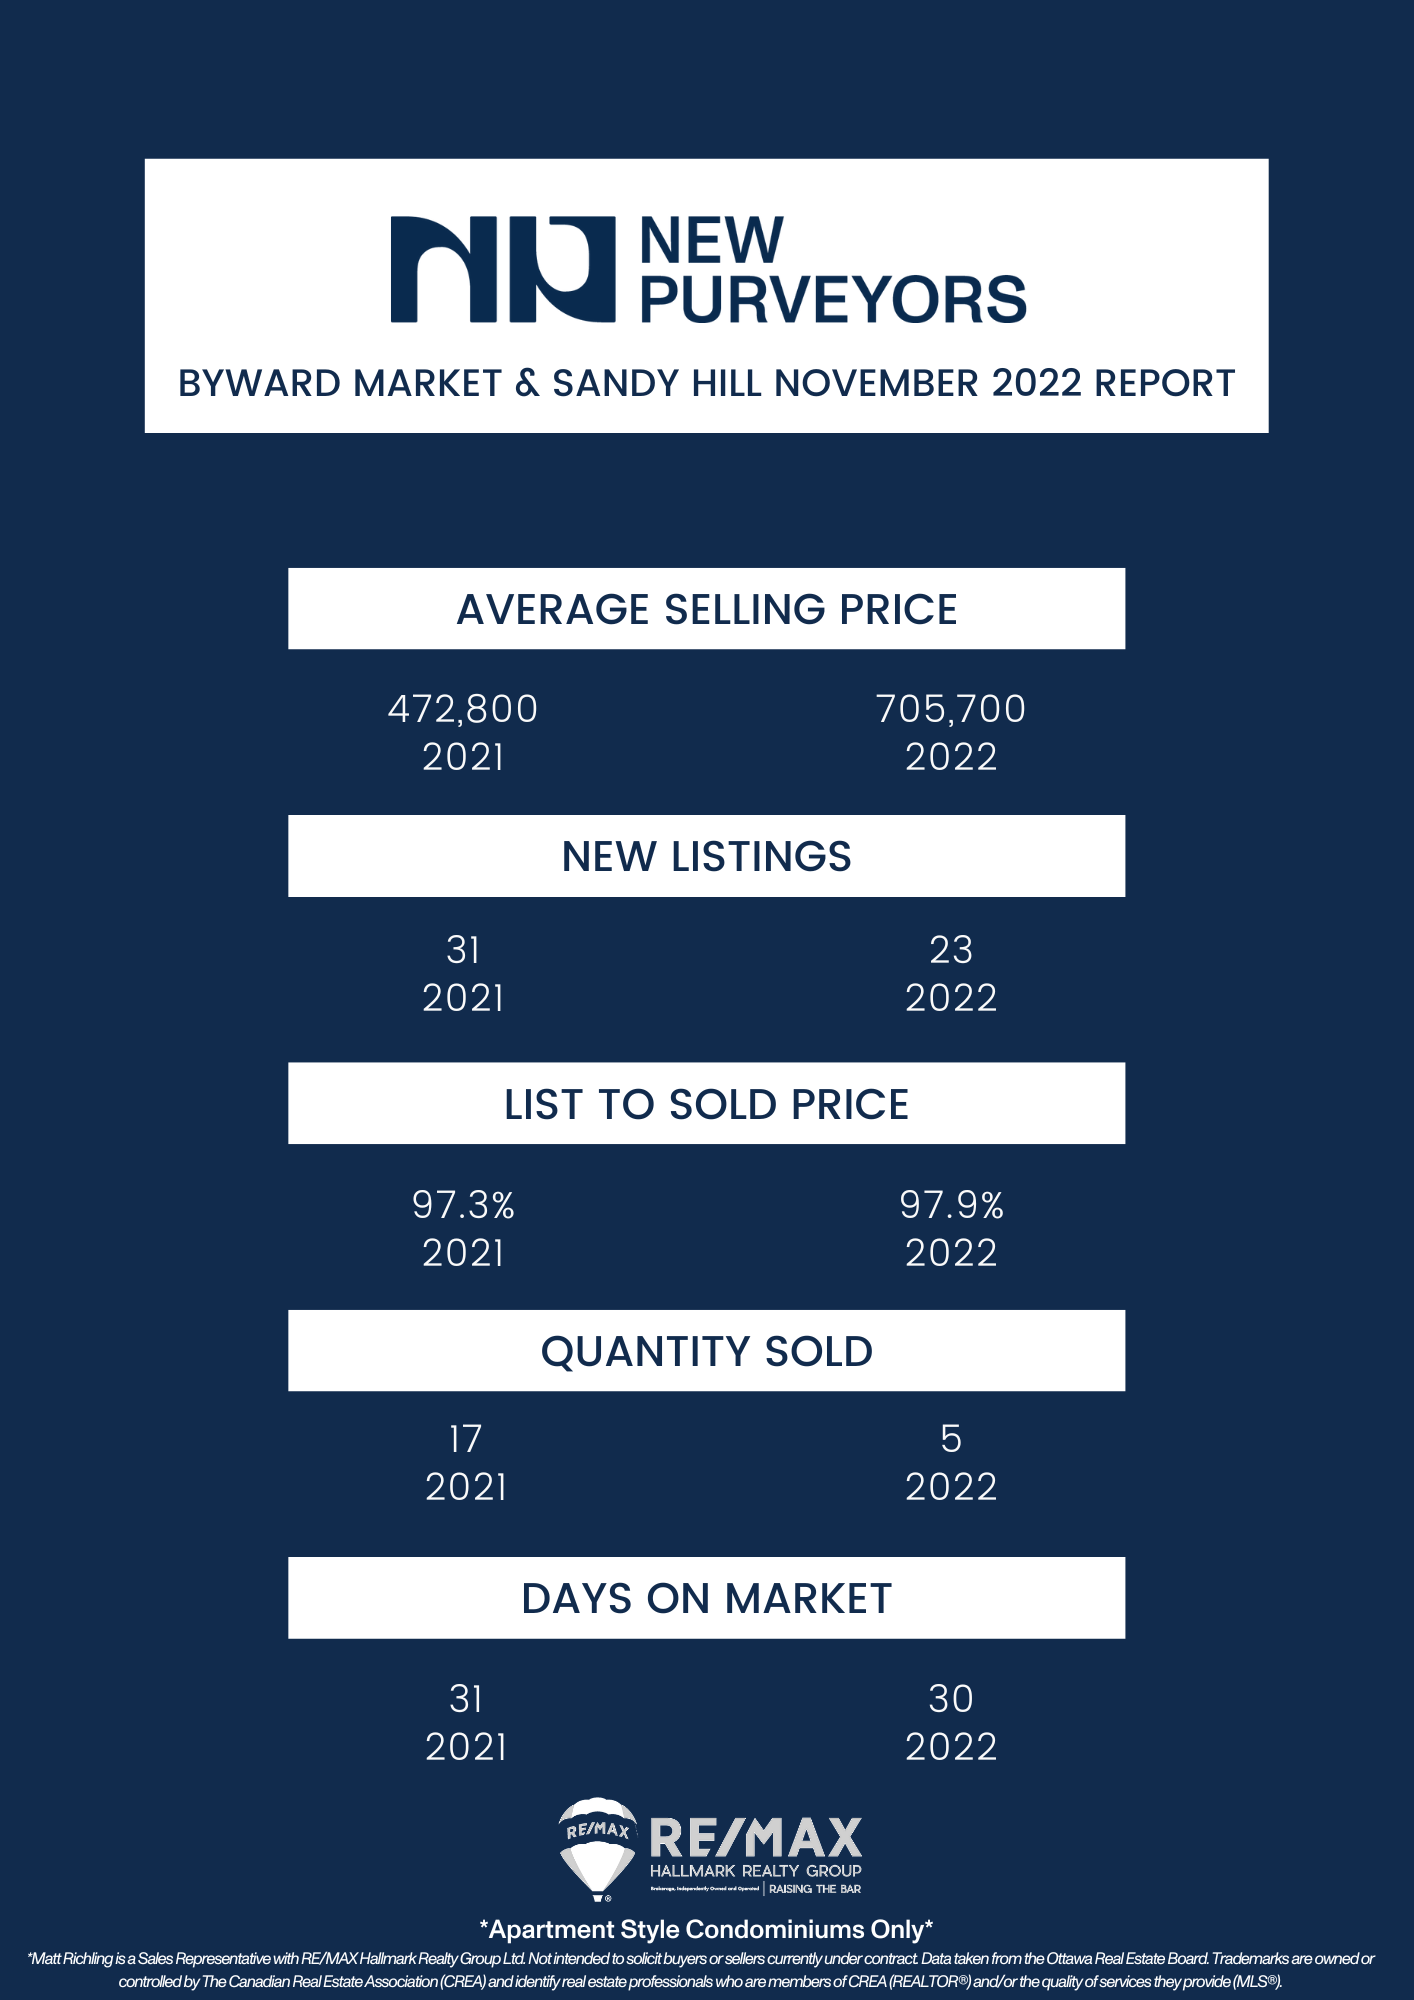
Every month we take a closer look and drill down the sales data of Ottawa condos from the previous month. Here are the statistics for November 2022 in the top five "downtown" areas - Centretown, Byward Market and Sandy Hill, Little Italy (which includes Lebreton Flats), Hintonburg, and Westboro. The information will be specific to apartment-style condominiums, and only what sold through the MLS. Also important to note that DOM (Day's On Market) is calculated to include the conditional period, which in Ottawa is roughly 14 days for almost every single transaction.
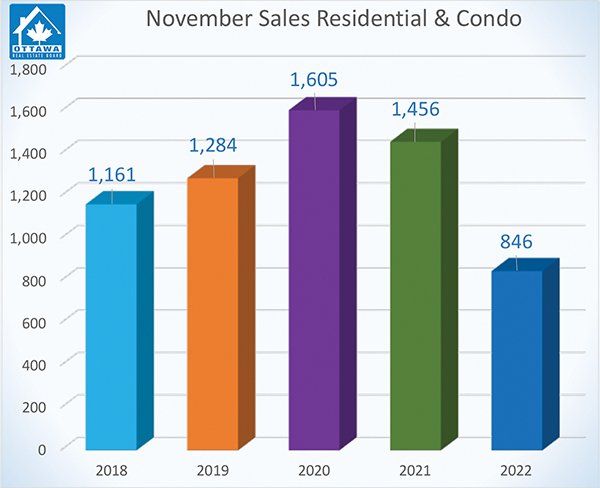
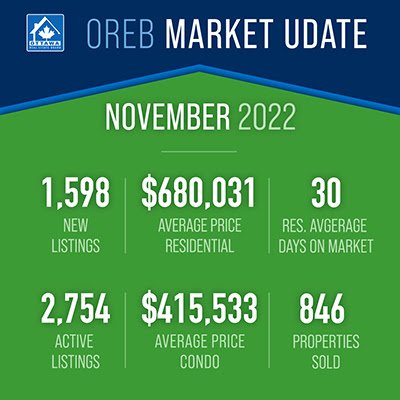
In the month of November, Ottawa Real Estate Board members sold 846 residential properties - down 42% from November 2021. 658 of these were residential, down 39%, and 188 were condominiums, down 50%. This is also a significant decrease from the 5-year average of sales in the month of November, which is 1270.
The president of the Ottawa Real Estate Board, Penny Torontow, explains that November’s sales are typically lower as the real estate market comes to a lull during the holiday season. But they also reflect the state of our economy. She explains that many people who can are waiting and watching to see what happens next, as our market is changing so quickly, and similar trends are appearing all over the world.
Prices are also decreasing. The average condominium this November cost $415,533, which is a decrease of 4% from November last year. The same is clear in residential housing, where the average property cost $680,031, a decrease of 5% from November last year.
So far, the year-to-date average for sale prices is $774,422 for residential homes and $454,436 for condominiums, which is still an 8% increase over 2021.
This new market has had a huge impact on first-time home buyers, Torontow explains. The massive decrease in condo sales illustrates that entry-level properties are becoming less attainable to their market. A quickly changing market and increased stress test requirements are forcing first-time buyers to stay on the sidelines in a rental market that is seeing a large uptick in prices as well.
In terms of inventory, we’ve seen a huge increase in residential properties from 0.9 months last year to 3.5 months this year. For condos, this has increased from 1.1 to 3.4 months. There was also a 12% increase in listed properties this month versus November 2021, from 1429 to 1598, but this is a 22% decrease from the 2046 listed in October of 2022. It is higher than the 5 year average for November of 1398 listed properties.
Torontow explains these new numbers illustrate a balanced market that is starting to tip towards the buyers. Sellers should work with an experienced agent who understands how to appropriately price a home and list it at an ideal time.
Important to note is that these statistics can only be as accurate as there are condos sold in Ottawa. The more condos sold in an area, the more accurate the averages will be.
Want to chat about your options? Fill out the form at the bottom of the page, or text/call us directly 613-900-5700 or fill out the form at the bottom of the page.
Do you have any questions about how this information affects your investment or looking for more information to make the best decision about your purchase? Let’s chat! Fill out the form on the bottom of the page.