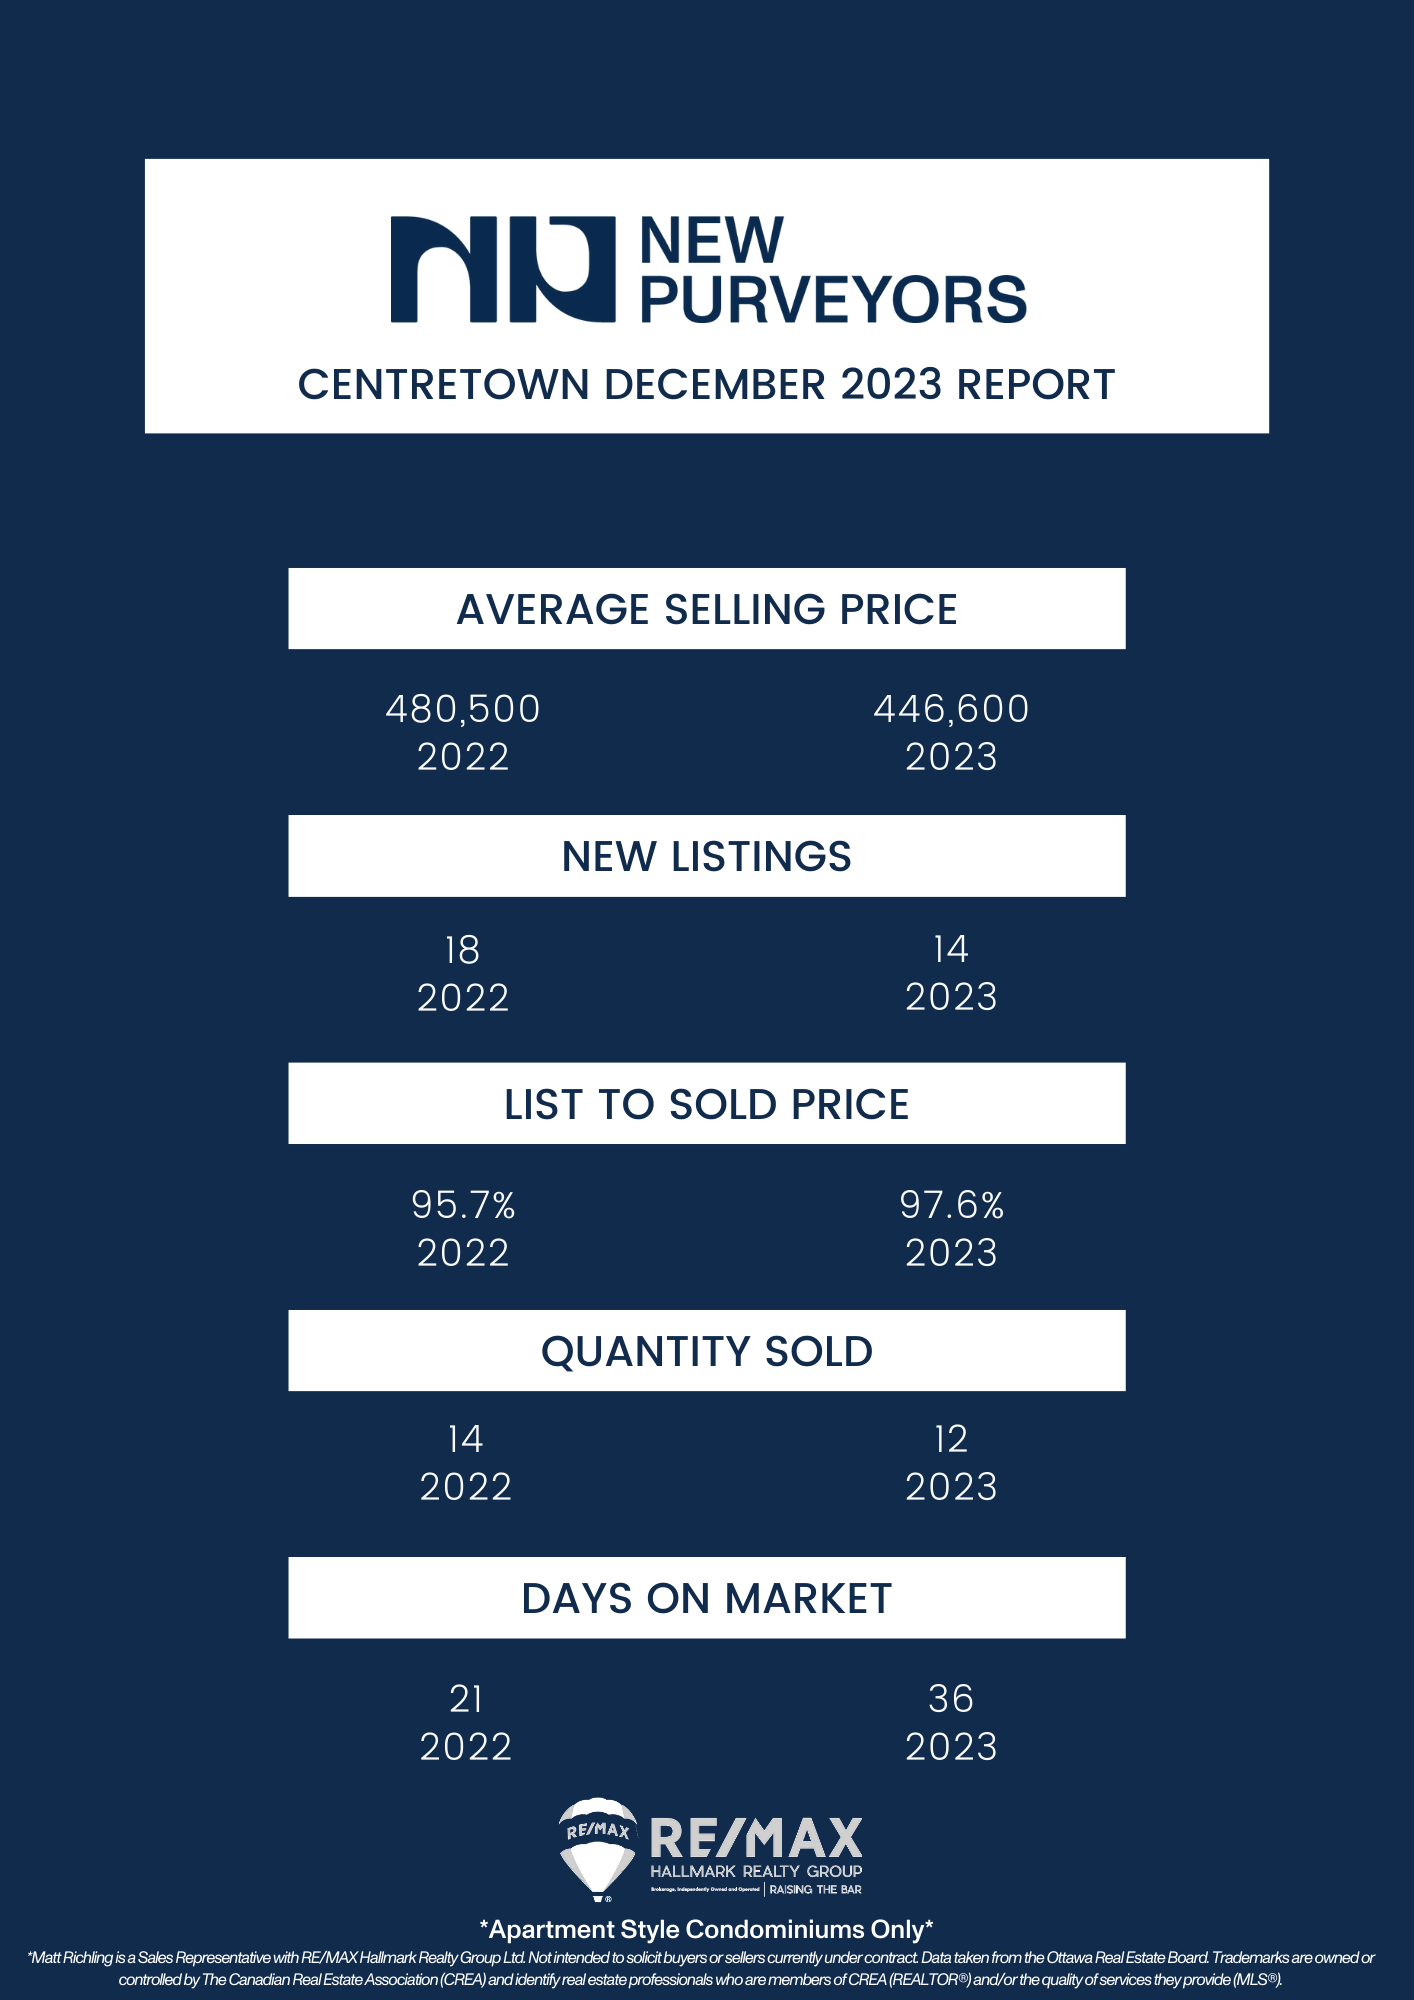
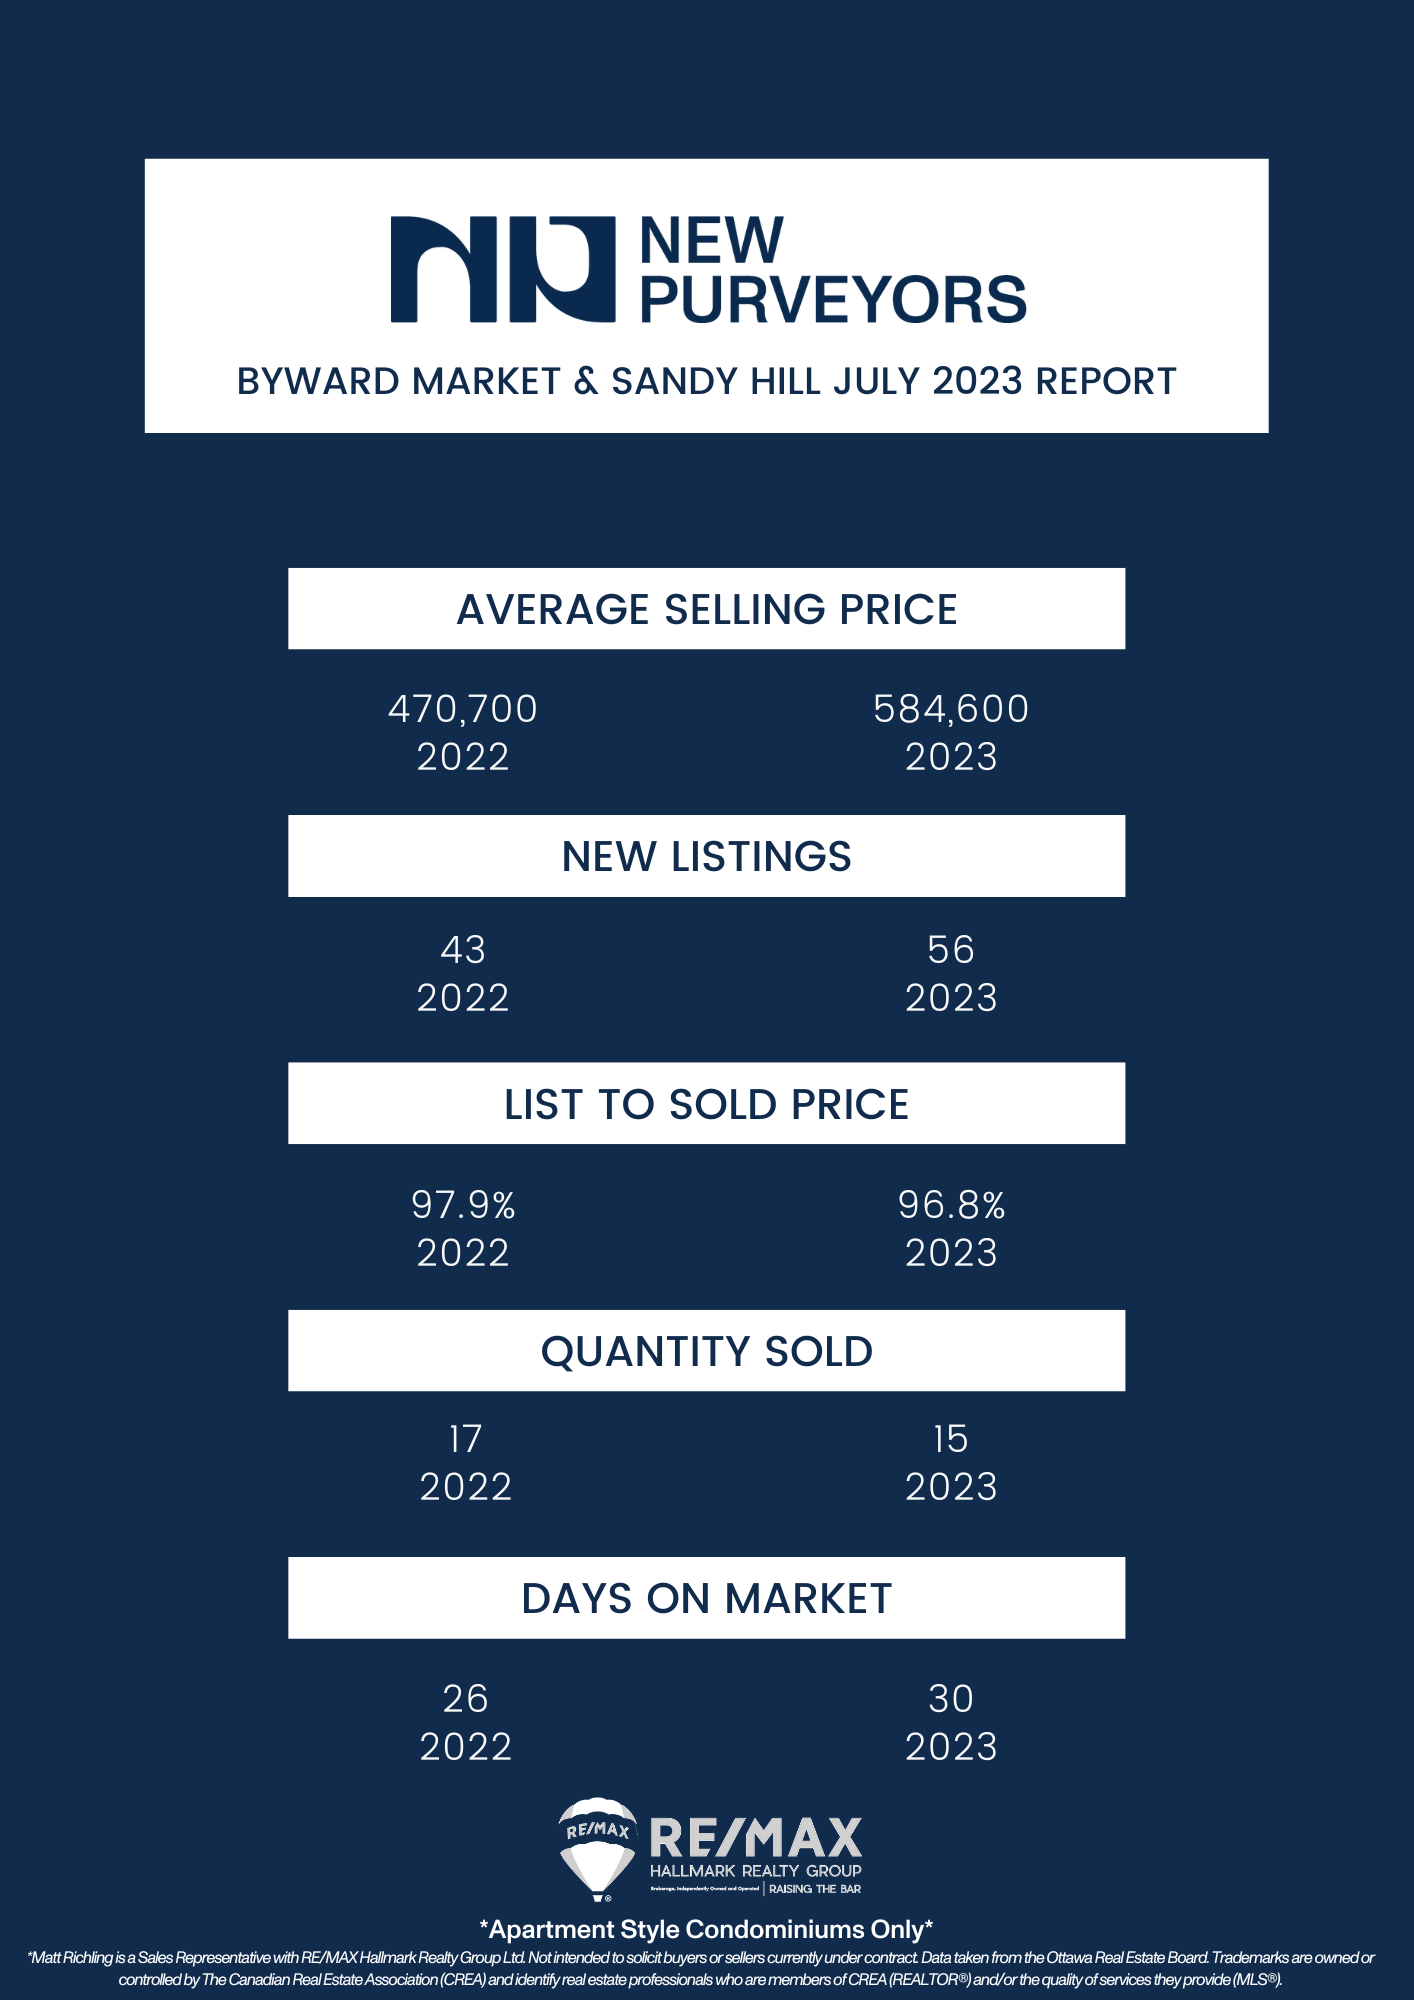
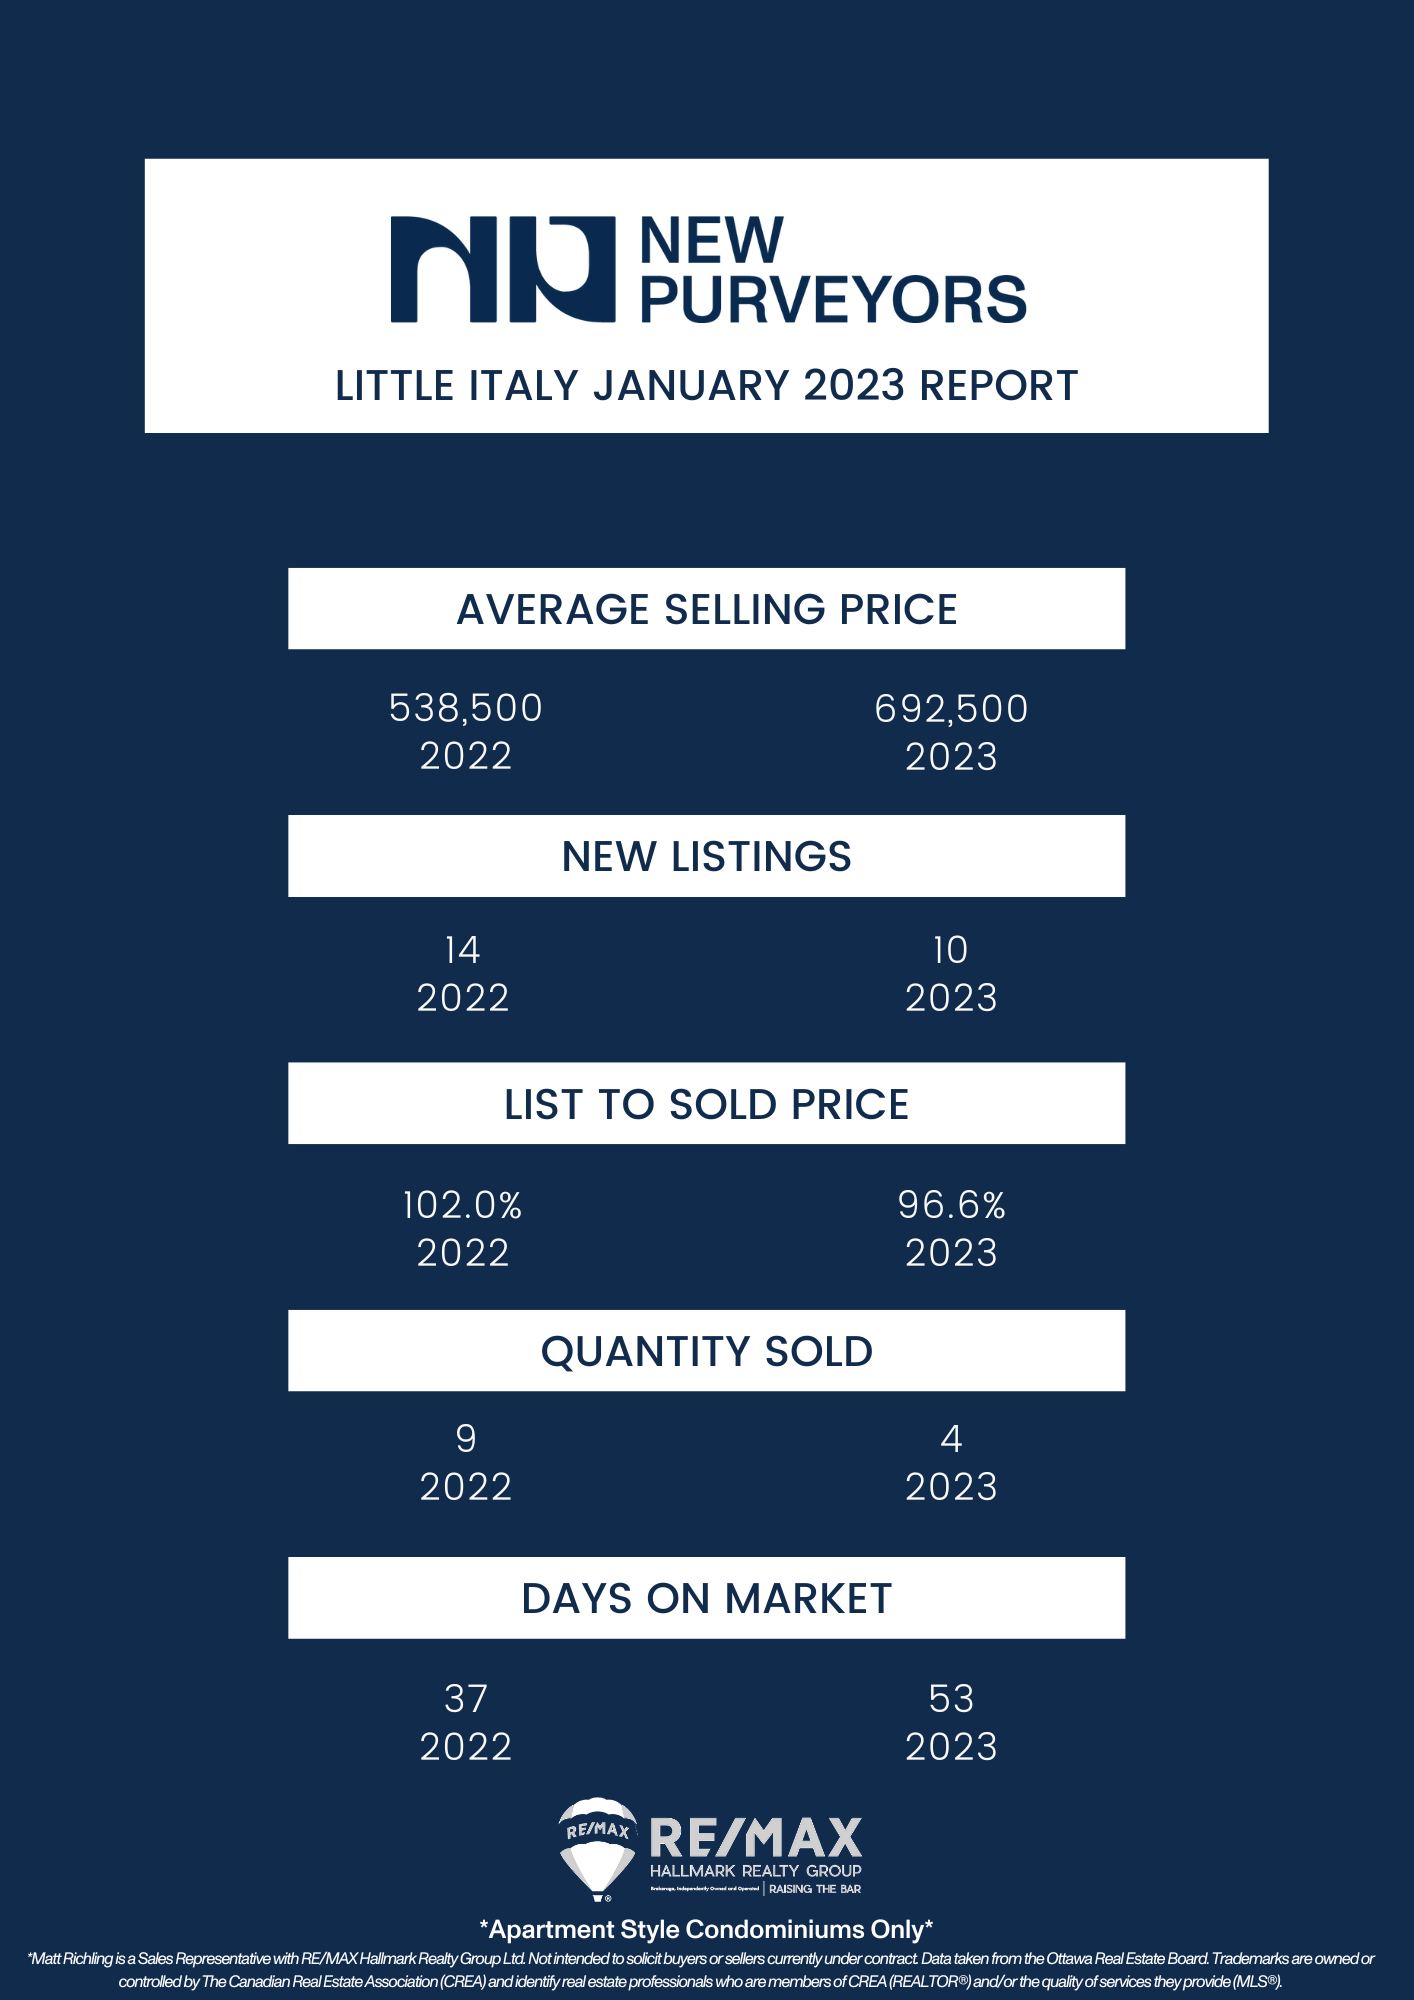
Every month we take a closer look and drill down the sales data of Ottawa condos from the previous month. Here are the statistics for March 2024 in the top five "downtown" areas - Centretown, Byward Market and Sandy Hill, Little Italy (which includes Lebreton Flats), Hintonburg, and Westboro. The information will be specific to apartment-style condominiums, and only what is sold through the MLS. Also important to note that DOM (Day's On Market) is calculated to include the conditional period, which in Ottawa is roughly 14 days for almost every single transaction.
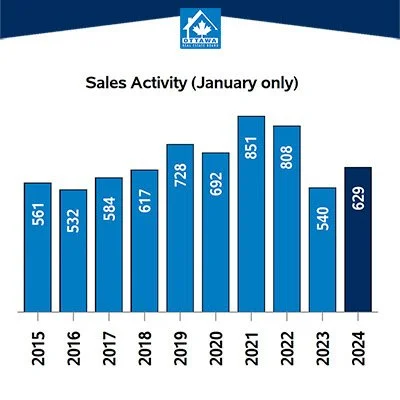
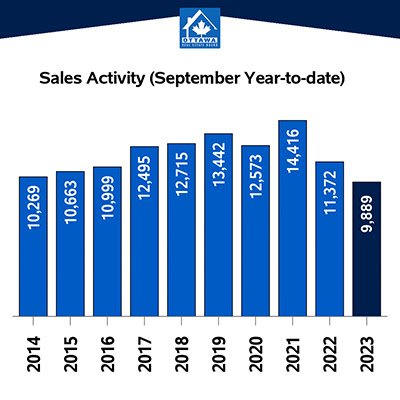
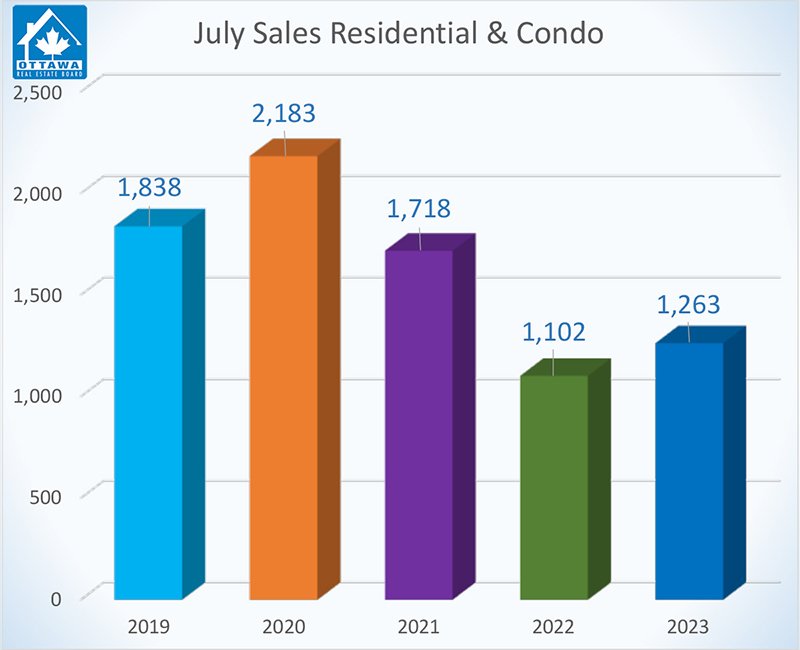
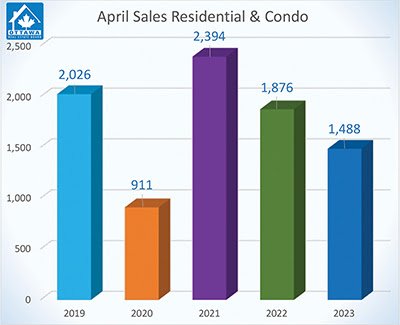
In March 2024, the Ottawa Real Estate Board recorded 1,165 homes sold via the MLS® System, marking a 10% increase over March 2023.
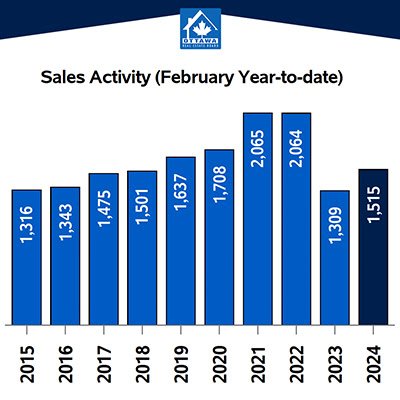
Home sales for the month were 21.5% below the five-year average and 15% below the 10-year average.
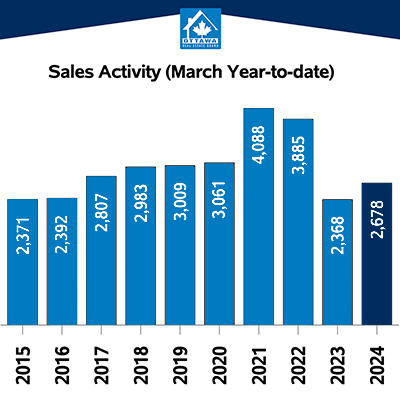
Year-to-date, home sales reached 2,678 units for the first three months of 2024, a 13.1% surge compared to the same period in 2023.
OREB President Curtis Fillier notes, "Ottawa's real estate landscape remains robust, setting the stage for an active spring and summer. Growing numbers of new listings and heightened showing activity indicate seller confidence is on the rise. However, buyers appear more hesitant, likely due to affordability concerns and limited supply."
Fillier observes a shifting dynamic in the market, fueled by post-pandemic adjustments in housing preferences. Some are downsizing or relocating from the outskirts, while others seek properties better suited to their evolving needs, creating pressure on the mid-range market. Fillier advises, "Engage promptly whether buying or selling, as the market dynamics are evolving swiftly."
The MLS® Home Price Index (HPI) provides a more precise gauge of price trends than average or median measures.
The composite benchmark price reached $636,700 in March 2024, up 2.7% from the previous year.
Single-family homes commanded a benchmark price of $719,000, reflecting a 2.6% increase year-over-year.
Townhouse/row units saw a modest uptick, with a benchmark price of $489,800, rising by 0.9% annually.
Benchmark apartment prices surged to $423,200, marking a 4.3% increase from the previous year.
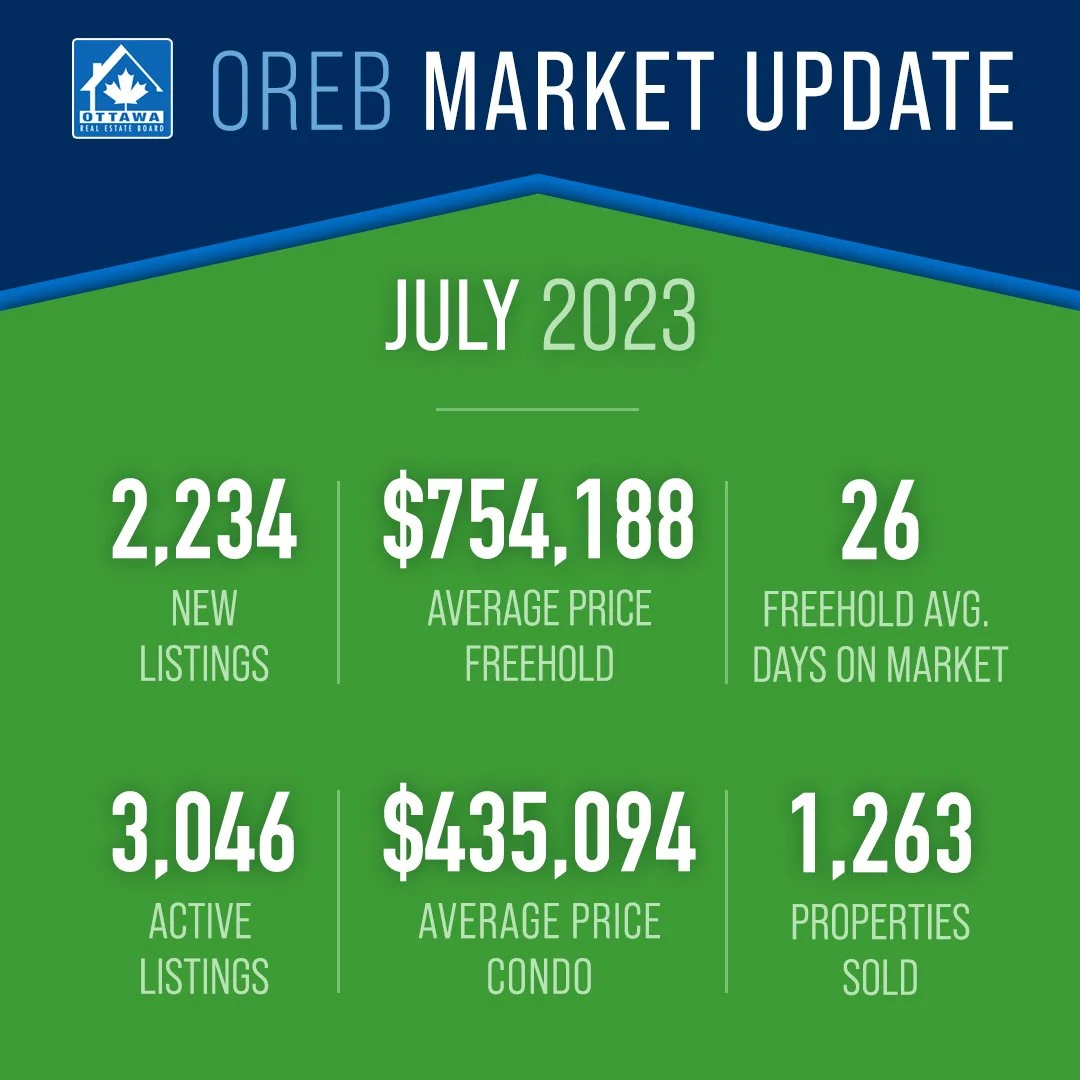
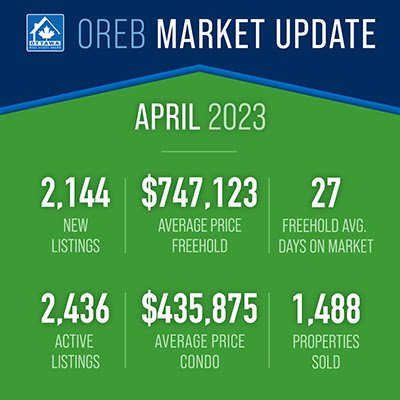
The average home price in March 2024 stood at $682,078, marking a 5.1% increase from March 2023. The year-to-date average price was $659,828, up 3.2% from the first three months of 2023.
Total home sales volume in March 2024 reached $794.6 million, a 15.6% surge compared to the same month in 2023.


OREB emphasizes that while the average sale price provides insight into trends, it shouldn't be relied upon to assess individual property values, as prices vary across neighbourhoods.
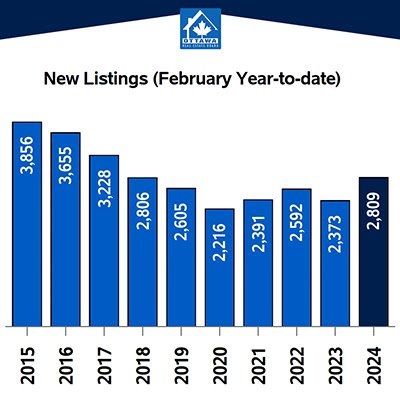
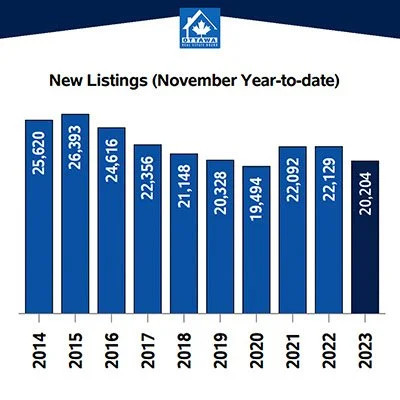
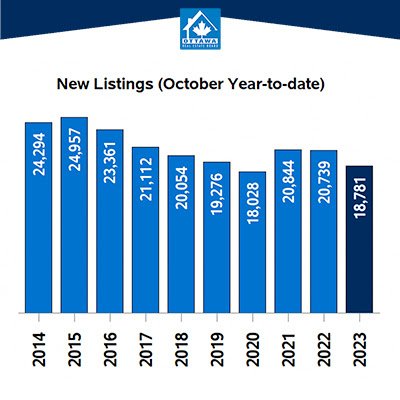
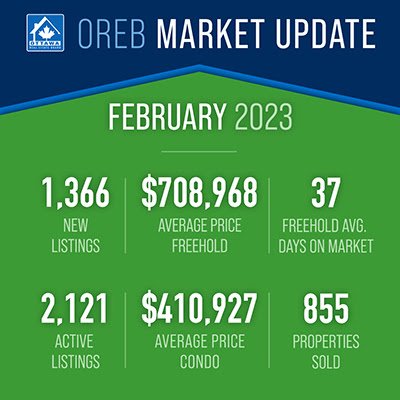
March 2024 saw a 13.5% increase in new listings compared to March 2023, totaling 2,074 new residential listings. New listings trailed the five-year average by 2.3% and the 10-year average by 11.1%.
Active residential listings reached 2,543 units by the end of March 2024, marking an 18.3% increase from March 2023. Active listings surpassed the five-year average by 58.6% but fell short of the 10-year average by 17.7%.
With inventory at 2.2 months by the end of March 2024, slightly higher than March 2023's 2 months, but below the long-term average of 2.6 months, indicating a balanced market. Months of inventory represents the time it would take to deplete current inventory at the current sales rate.
Important to note is that these statistics can only be as accurate as there are condos sold in Ottawa. The more condos sold in an area, the more accurate the averages will be.
Want to chat about your options? Fill out the form at the bottom of the page, or text/call us directly at 613-900-5700 or fill out the form at the bottom of the page.
Do you have any questions about how this information affects your investment or looking for more information to make the best decision about your purchase? Let’s chat! Fill out the form on the bottom of the page.