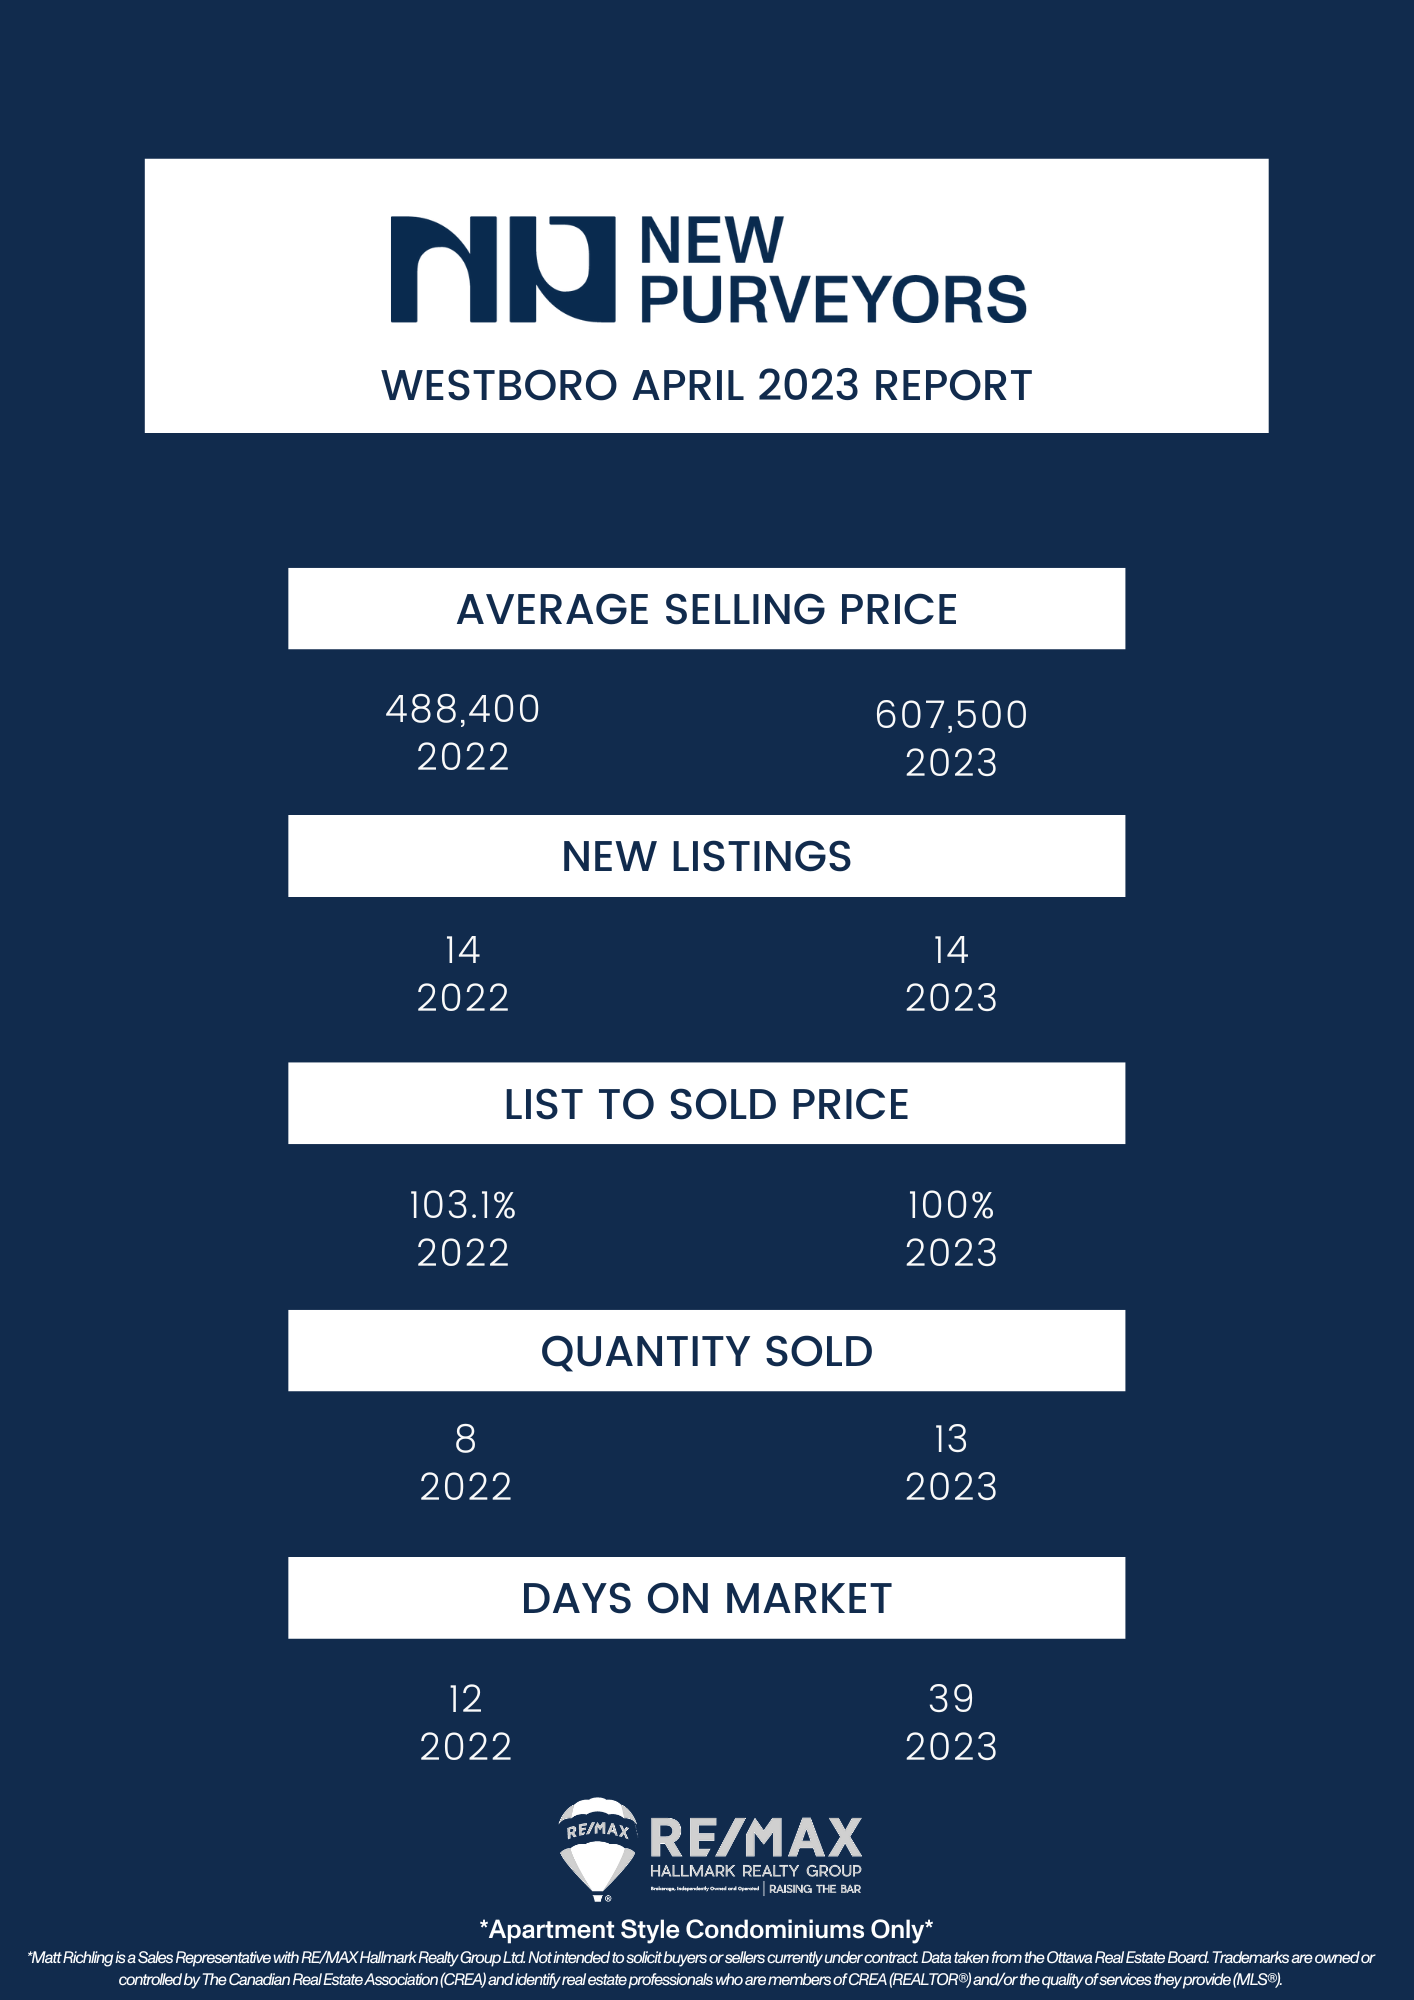
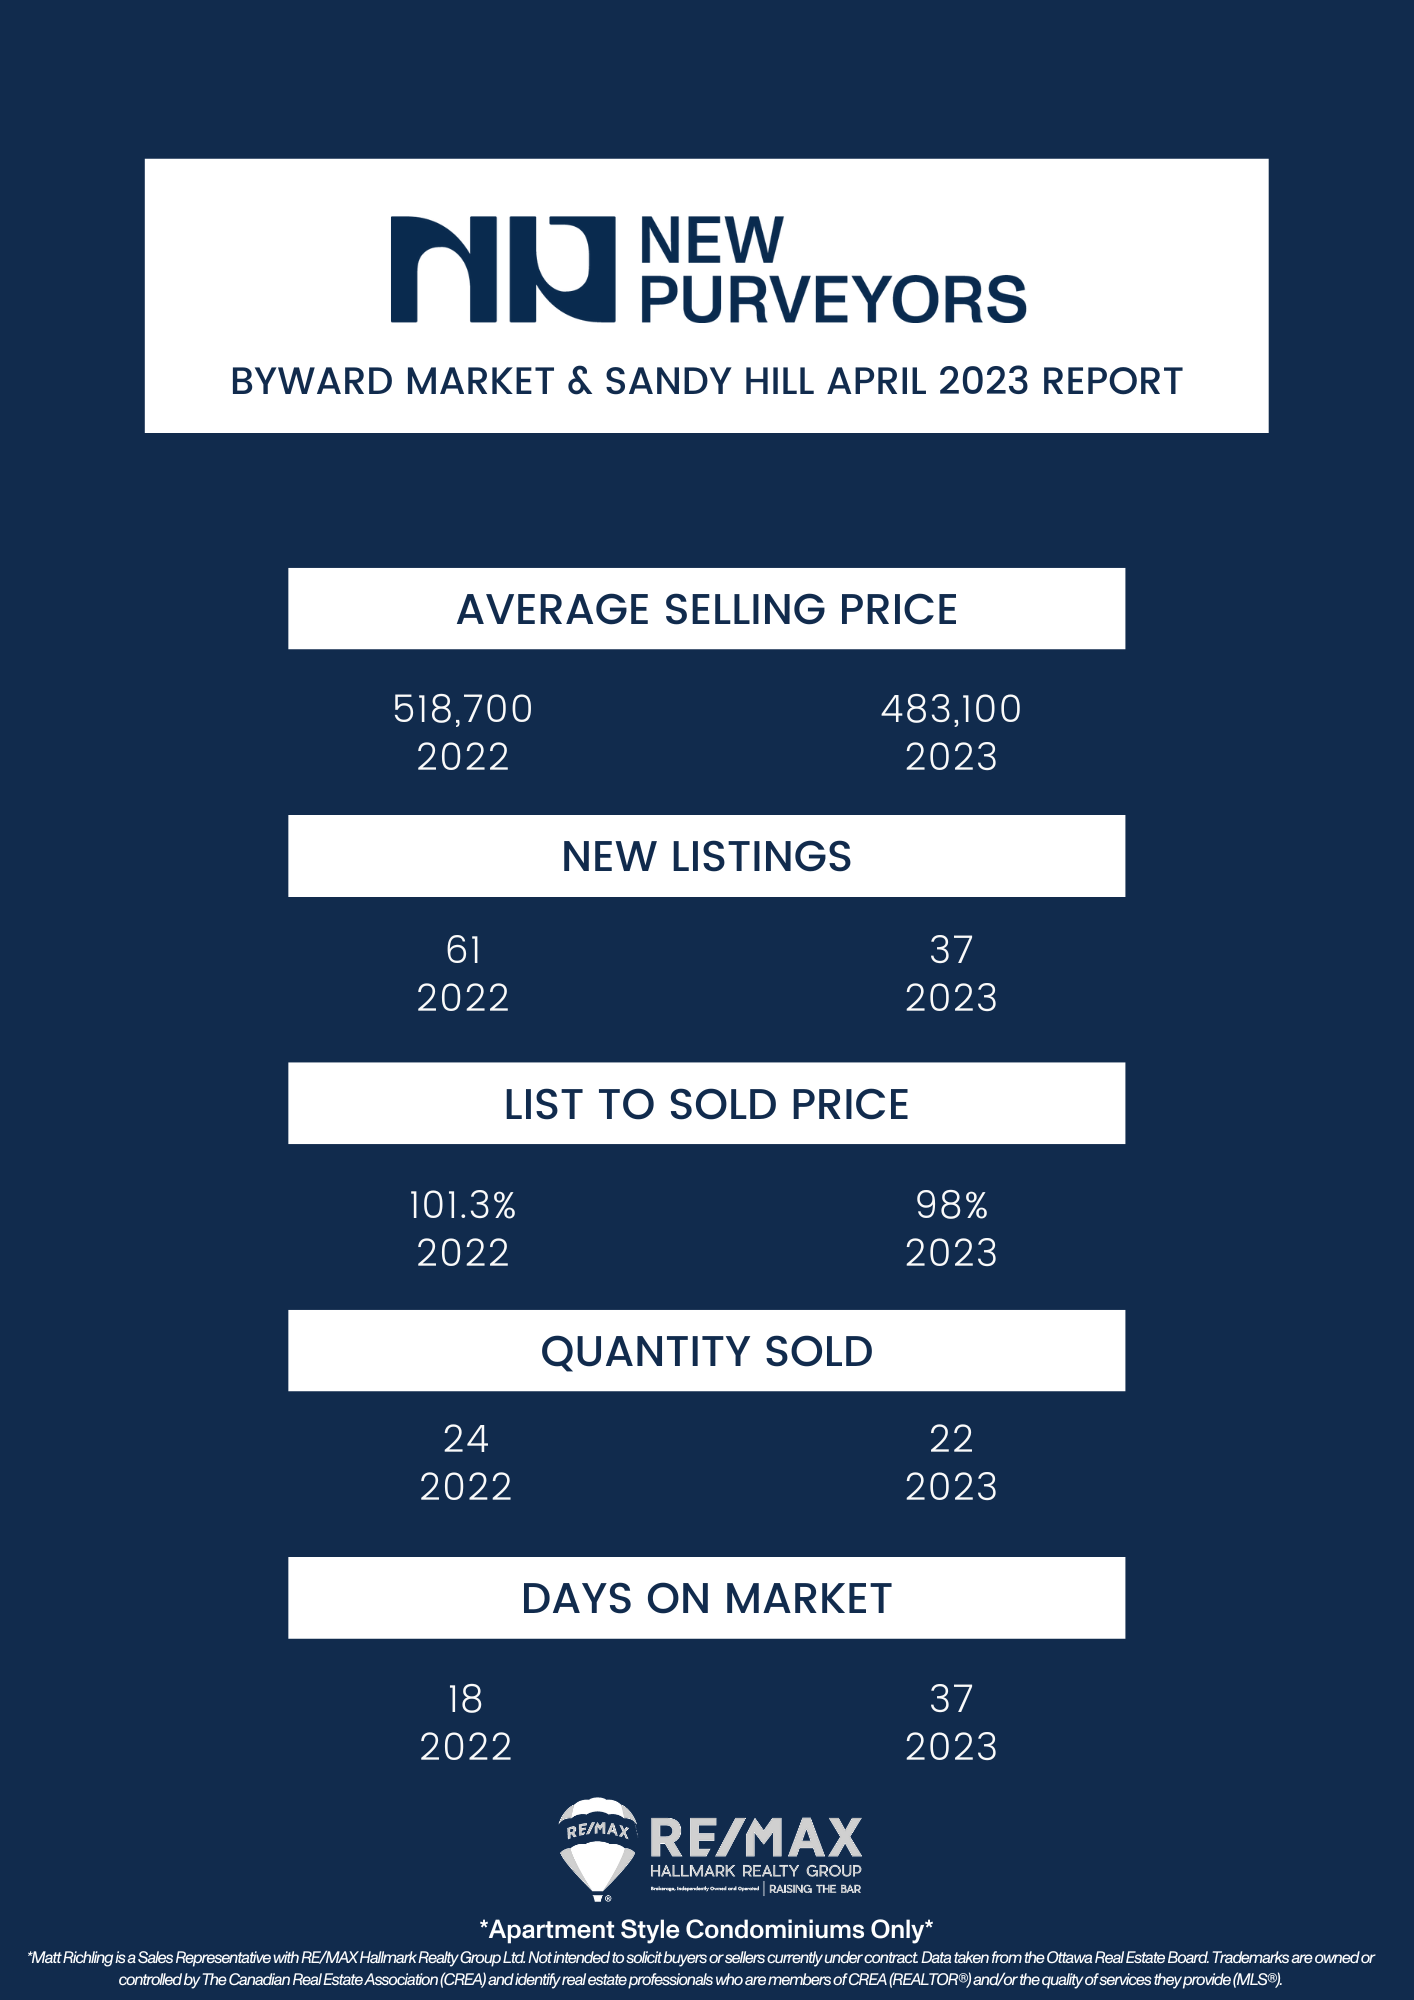
Every month we take a closer look and drill down the sales data of Ottawa condos from the previous month. Here are the statistics for April 2023 in the top five "downtown" areas - Centretown, Byward Market and Sandy Hill, Little Italy (which includes Lebreton Flats), Hintonburg, and Westboro. The information will be specific to apartment-style condominiums, and only what sold through the MLS. Also important to note that DOM (Day's On Market) is calculated to include the conditional period, which in Ottawa is roughly 14 days for almost every single transaction.
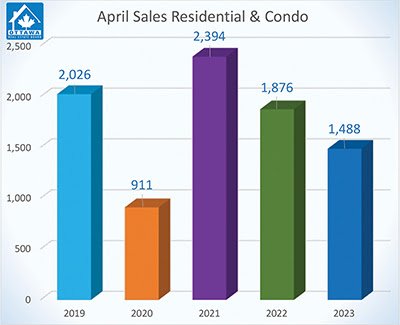
In April, the Ottawa Real Estate Board saw 1488 residential properties sold through MLS. This is down 21% from April 2022, where we saw 1876 sales. This month’s sales included 1156 freehold homes (down 18%) and 332 condominium units (down 29%). This month’s total sales is also significantly lower than the 5-year average for April, which is 1739 sales.
Despite historically low numbers, Ken Dekker, President of the Ottawa Real Estate Board, explains that we are still seeing Ottawa’s resale market on an upward trend. We’re seeing numbers closer to what we were seeing during peak pandemic activity in 2022, which is encouraging. However, he also states that new listings are not keeping up to this activity, so inventory is declining quickly, meaning we’re headed back into a seller’s market.
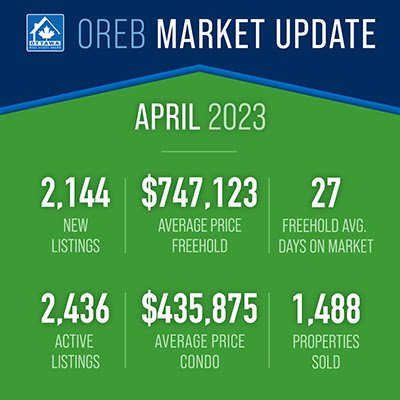
Average prices in Ottawa have increased over the last few months by 13.9%. In freehold properties, average prices are down 10% year over year, but still up 5% over the previous month. Condominiums are also down year over year by 8%, but are up 4% from last month.
Dekker explains that pressure on sales prices has continued - average prices have increased each month of this year, and we’re seeing more and more multiple offer situations and less days on market. Low inventory is affecting supply, and the pressure on buyers is coming back.
In April, the city saw 2144 new listings, 25% down from the 2943 in 2022. This is slowly catching up to the 5 year average for new listings in April, which is 2575. Freehold property inventory has increased from April 2022 where it was 0.9 months to 1.9 months, but this is down from March’s 2.3 months of inventory. In condominiums, we also have 1.9 months of inventory, up from 0.8 in APril of 2022 but down from 2.1 months in March of 2023. Days on market is down from 34 to 37 in freeholds and from 39 to 33 for condominiums.
In the world of rentals, OREB members helped 2152 rental clients find their new home, up 20% from 1786 this time last year.
Important to note is that these statistics can only be as accurate as there are condos sold in Ottawa. The more condos sold in an area, the more accurate the averages will be.
Want to chat about your options? Fill out the form at the bottom of the page, or text/call us directly 613-900-5700 or fill out the form at the bottom of the page.
Do you have any questions about how this information affects your investment or looking for more information to make the best decision about your purchase? Let’s chat! Fill out the form on the bottom of the page.