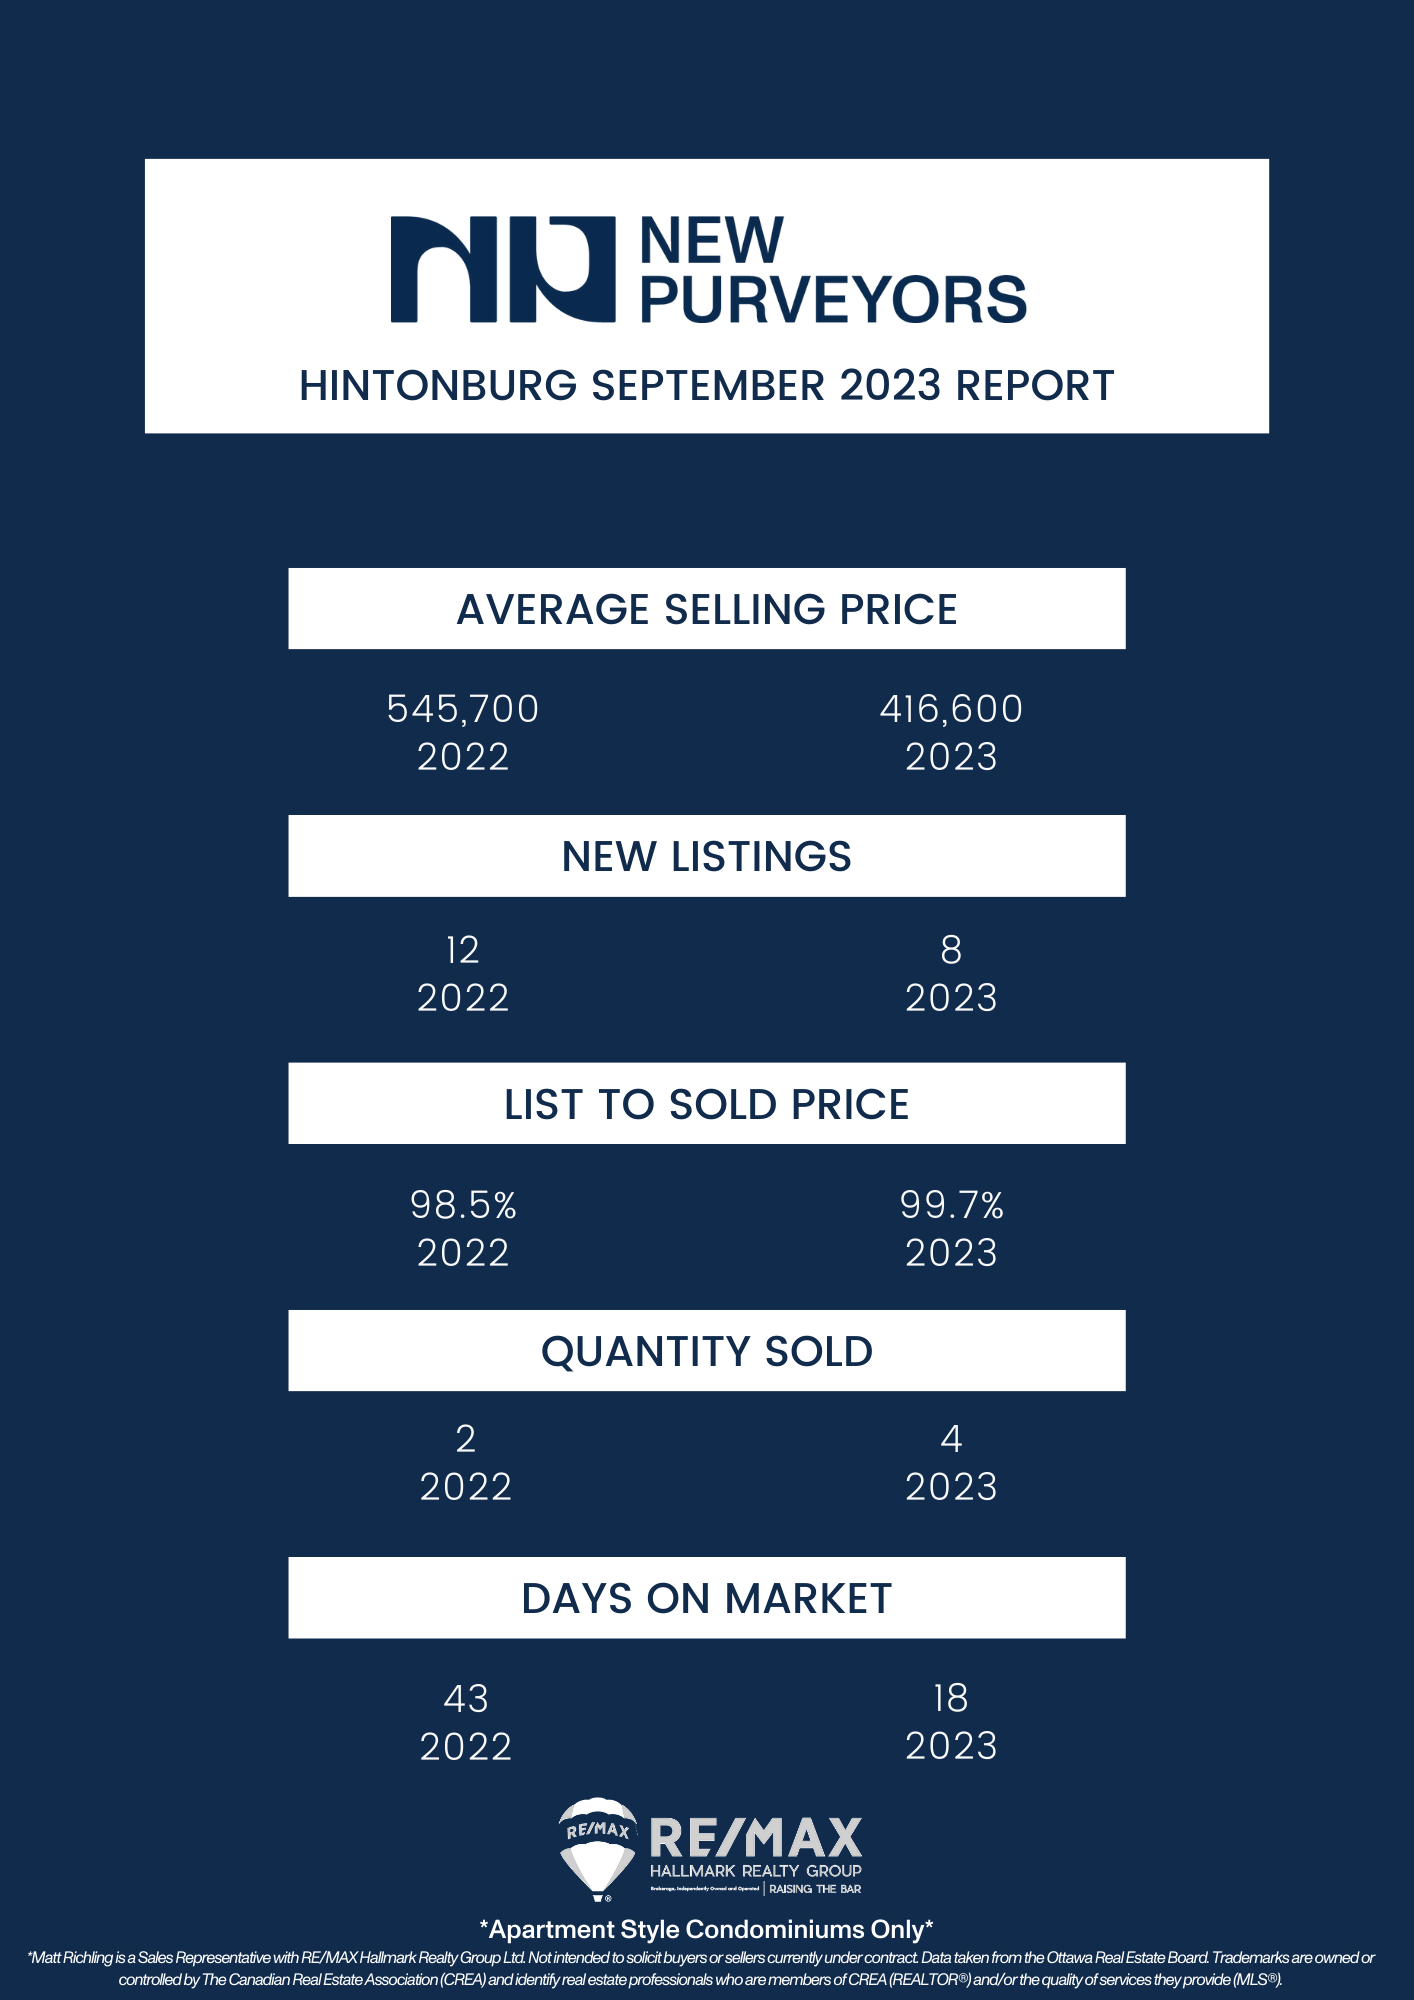
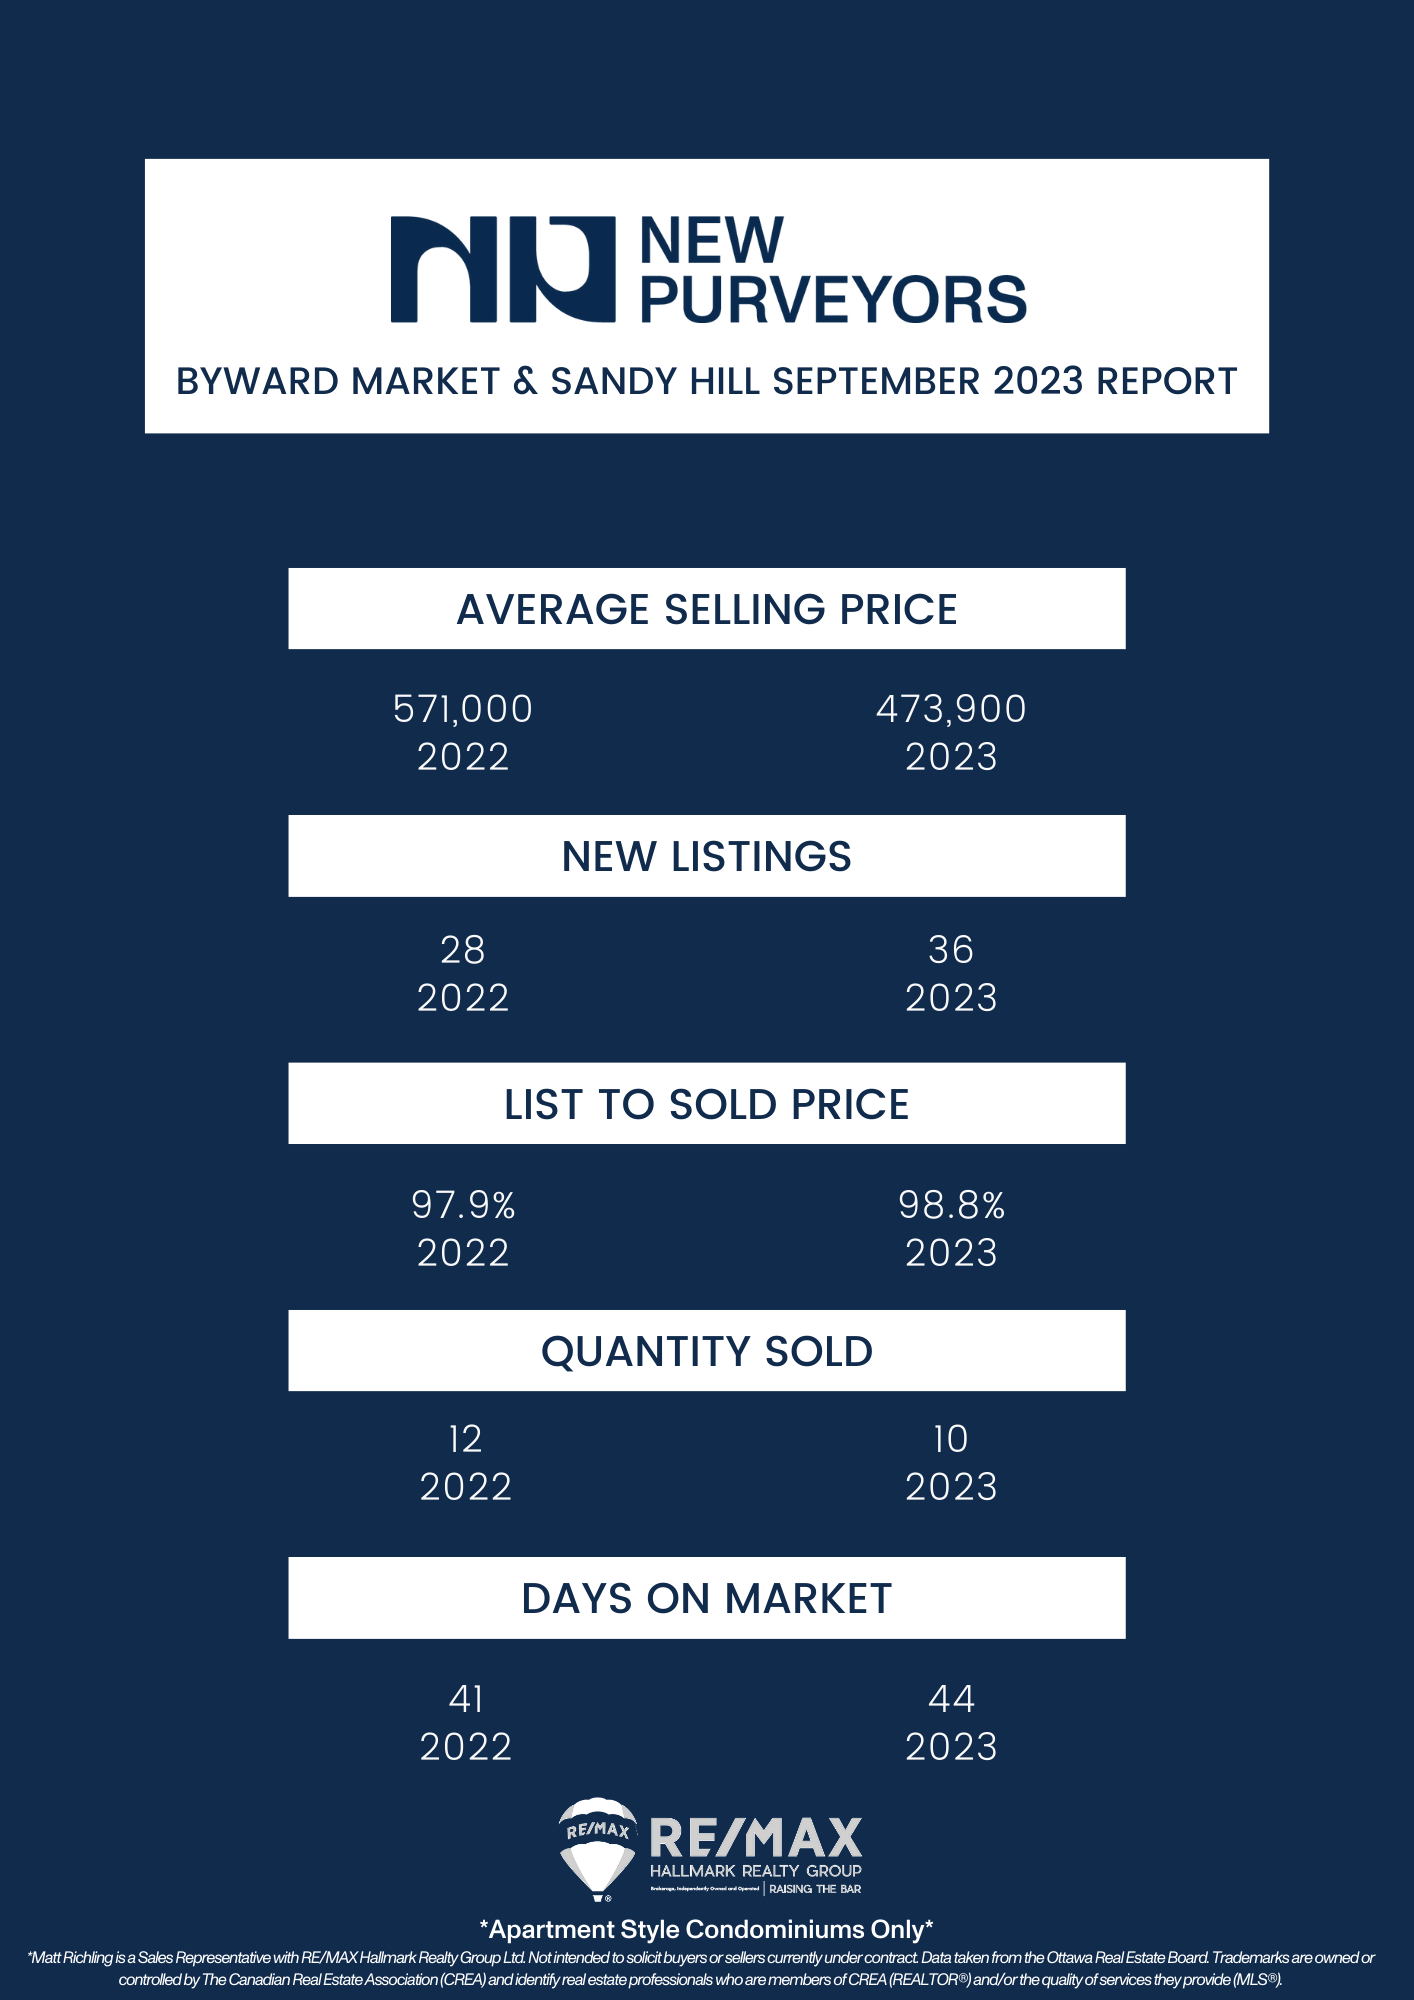
Every month we take a closer look and drill down the sales data of Ottawa condos from the previous month. Here are the statistics for September 2023 in the top five "downtown" areas - Centretown, Byward Market and Sandy Hill, Little Italy (which includes Lebreton Flats), Hintonburg, and Westboro. The information will be specific to apartment-style condominiums, and only what sold through the MLS. Also important to note that DOM (Day's On Market) is calculated to include the conditional period, which in Ottawa is roughly 14 days for almost every single transaction.
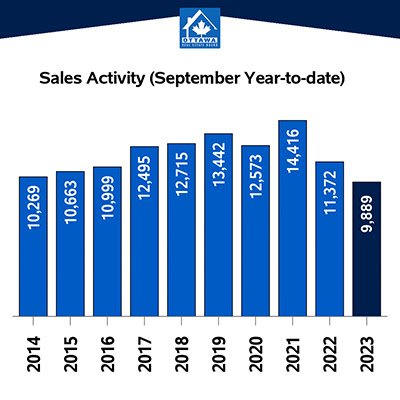
In September 2023, the Ottawa Real Estate Board (OREB) reported a total of 946 homes sold through the MLS® System, marking no change from the same month in 2022.
The sales figures for September were notably 29.6% below the five-year average and 23.6% below the 10-year average. Looking at the year-to-date perspective, home sales amounted to 9,889 units over the first nine months, indicating a significant 13% decrease compared to the same period in 2022.
OREB President Ken Dekker commented, "Sales activity remains consistent with last year but falls below the usual levels for September. A surge in new listings over the past few months has led to a gradual increase in overall inventories. Despite this, the available supply remains historically low, with room for absorbing additional listings. Our market is currently in a balanced state, and while MLS® Benchmark prices have decreased from last year, they are trending at levels similar to 2021."
Turning our attention to pricing trends, the MLS® Home Price Index (HPI) is highlighted as a more accurate measure compared to average or median price calculations. In September 2023, the overall MLS® HPI composite benchmark price stood at $643,600, showing a marginal increase of 0.5% from the same month in 2022. The benchmark prices for single-family homes and townhouse/row units saw slight changes, while the benchmark apartment price experienced a modest decline.
The average price of homes sold in September 2023 was $675,412, reflecting a 2.7% increase from September 2022. However, the year-to-date average price of $672,837 indicated a decline of 6.5% from the first nine months of 2022.
The total dollar value of home sales in September 2023 reached $638.9 million, a modest 2.7% increase from the same month in 2022. OREB emphasizes that while the average sale price is useful for establishing trends, it should not be considered an indicator of specific property value changes, as prices vary by neighborhood.
Looking at new listings, there was a 9.8% increase from September 2022, with 2,259 new residential listings in September 2023. Active residential listings at the end of September 2023 totaled 2,997 units, marking a substantial 14% increase from the end of September 2022 and reaching a five-year high for the month of September.
The months of inventory, indicating the time it would take to sell current inventories at the current sales rate, numbered 3.2 at the end of September 2023. While this was an increase from the 2.8 months recorded in September 2022, it remained below the long-run average of 3.3 months for this time of year.


Important to note is that these statistics can only be as accurate as there are condos sold in Ottawa. The more condos sold in an area, the more accurate the averages will be.
Want to chat about your options? Fill out the form at the bottom of the page, or text/call us directly 613-900-5700 or fill out the form at the bottom of the page.
Do you have any questions about how this information affects your investment or looking for more information to make the best decision about your purchase? Let’s chat! Fill out the form on the bottom of the page.