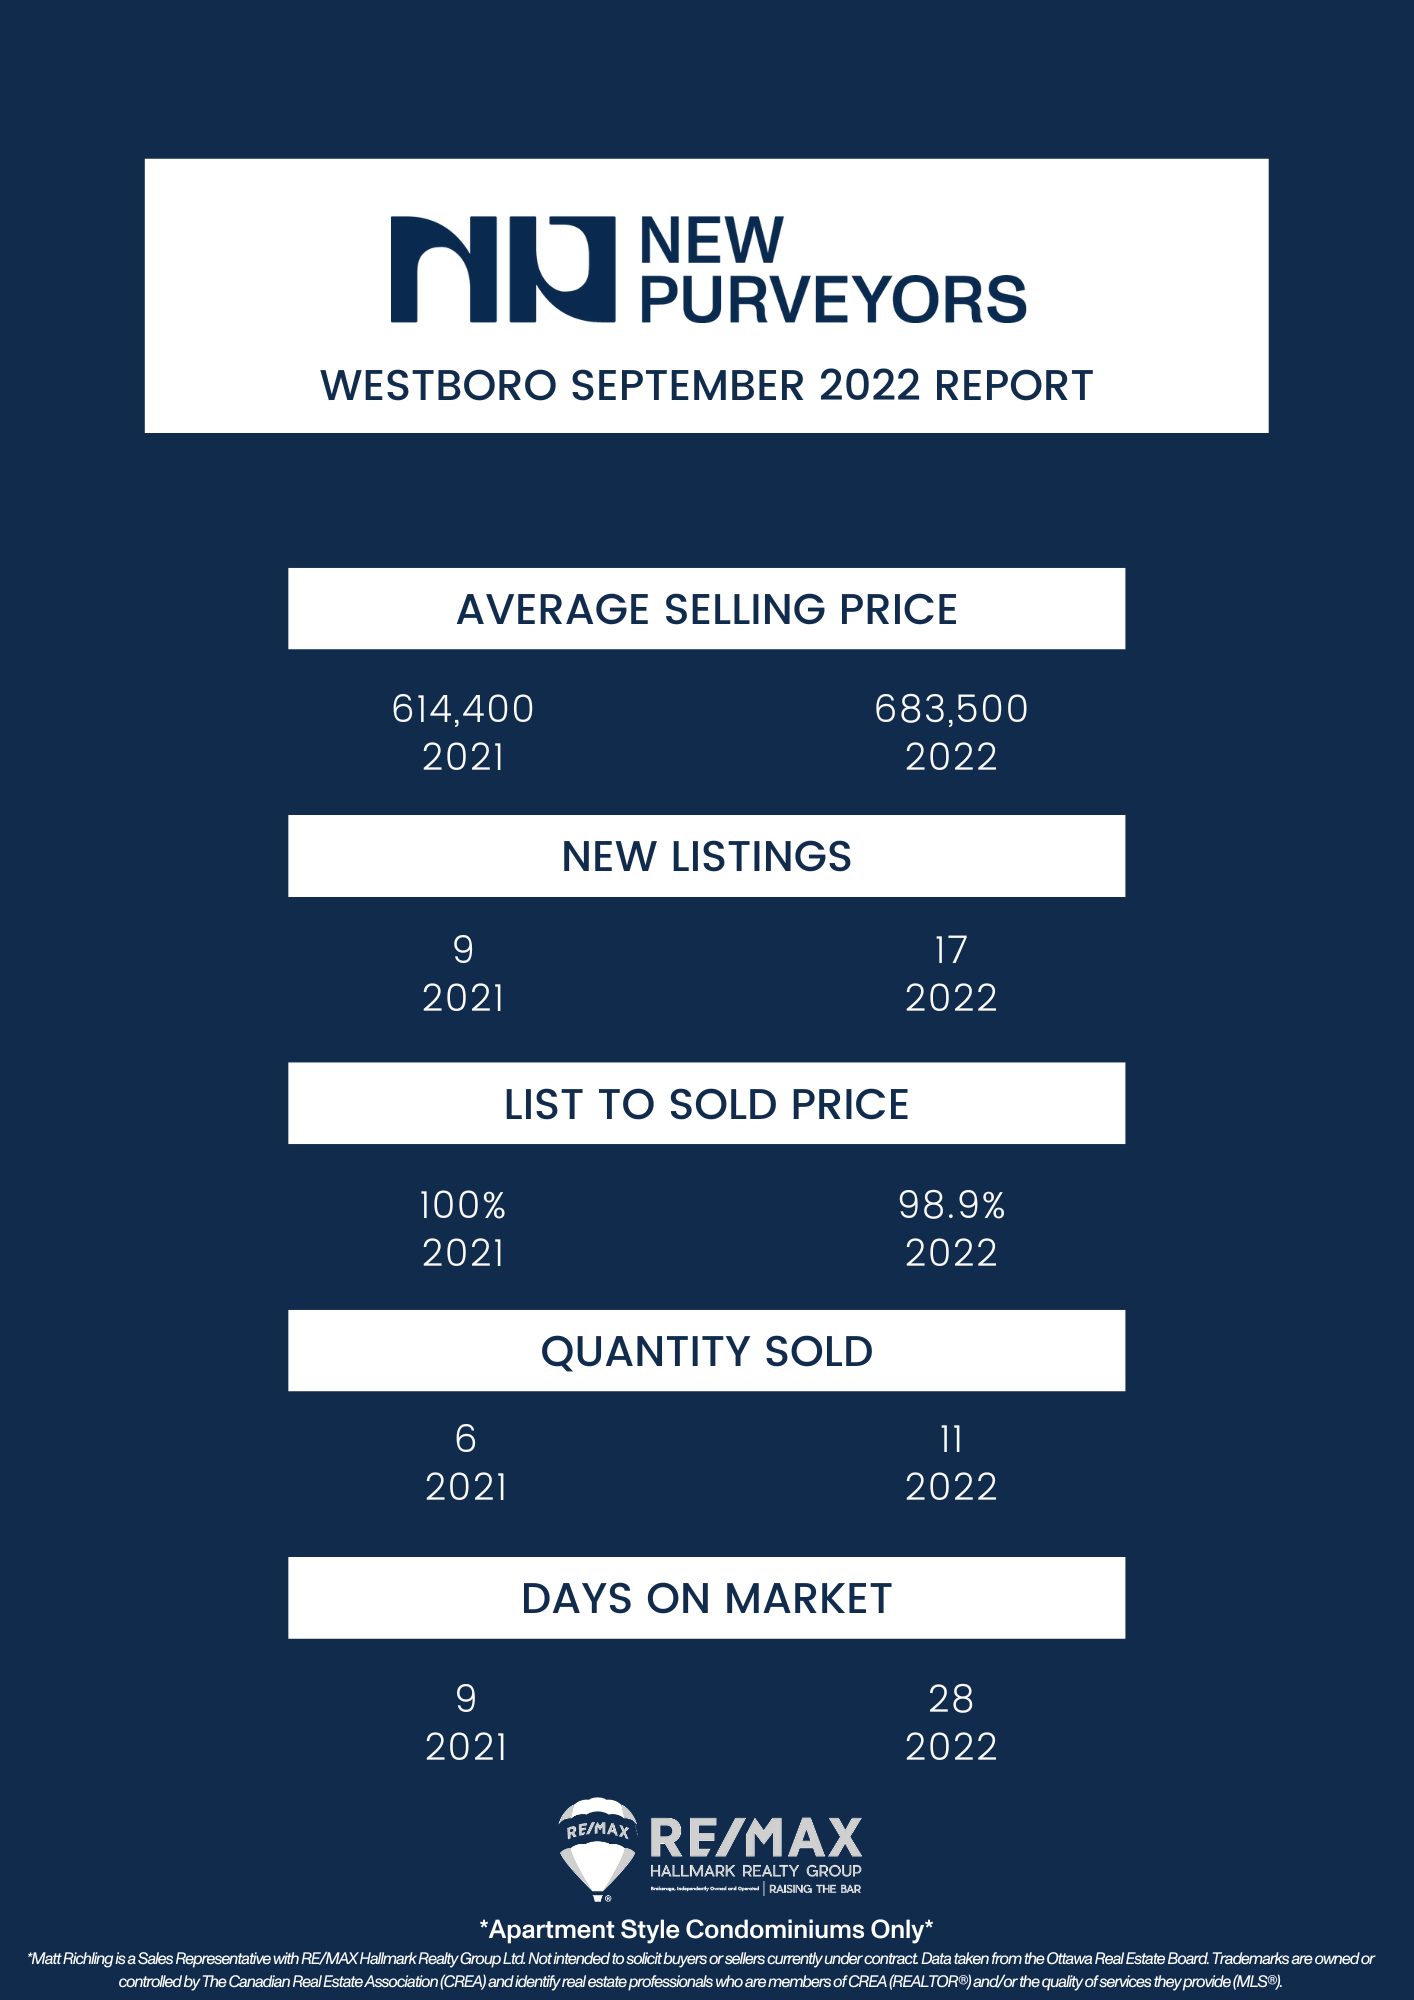
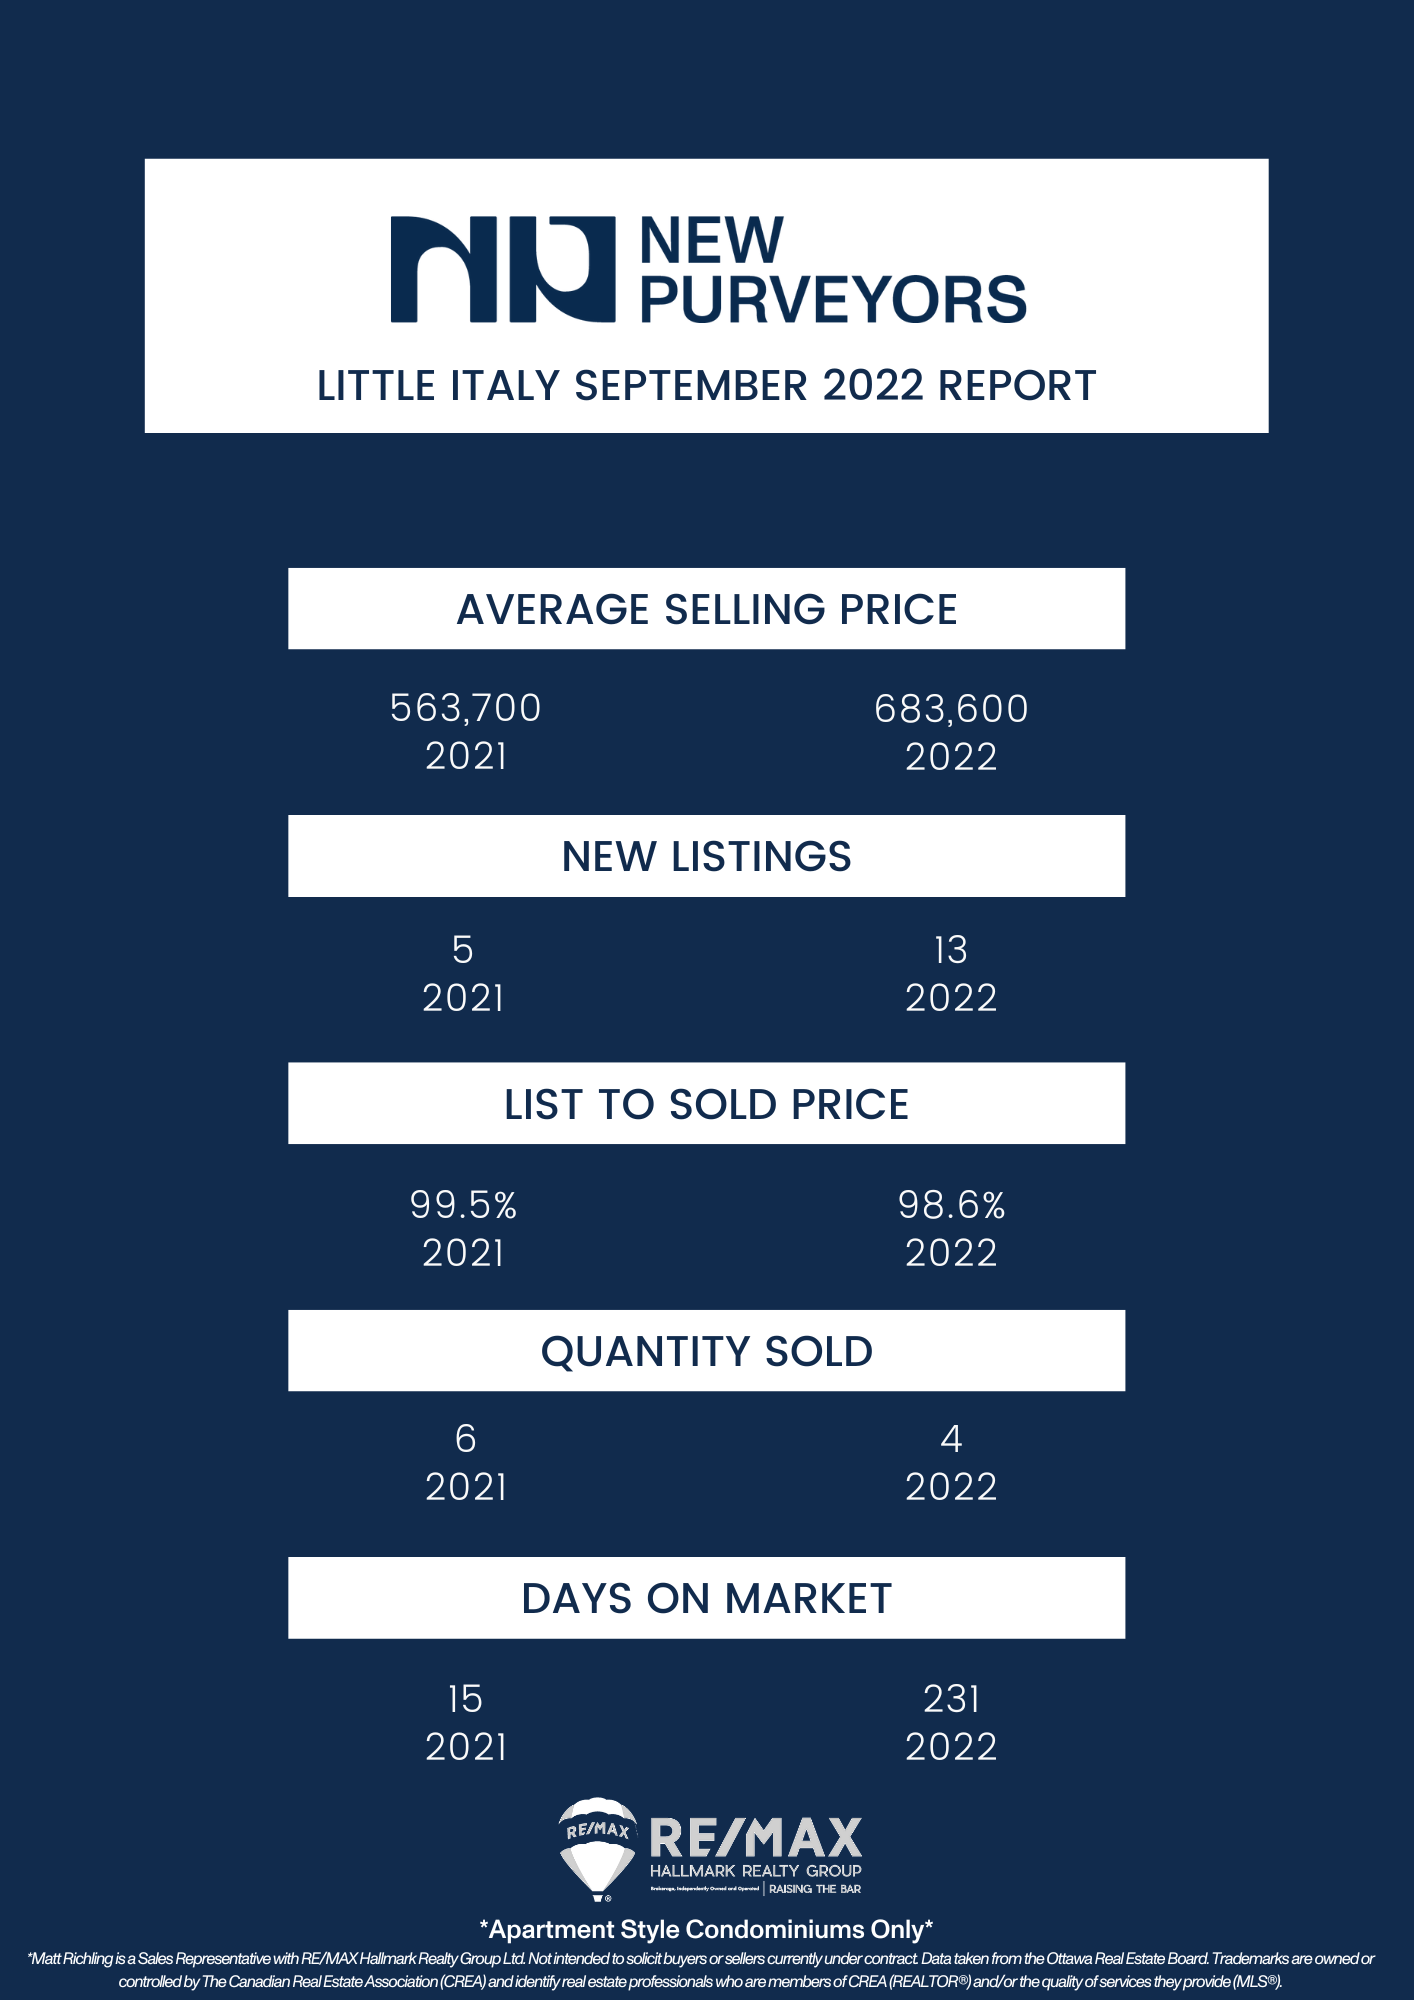
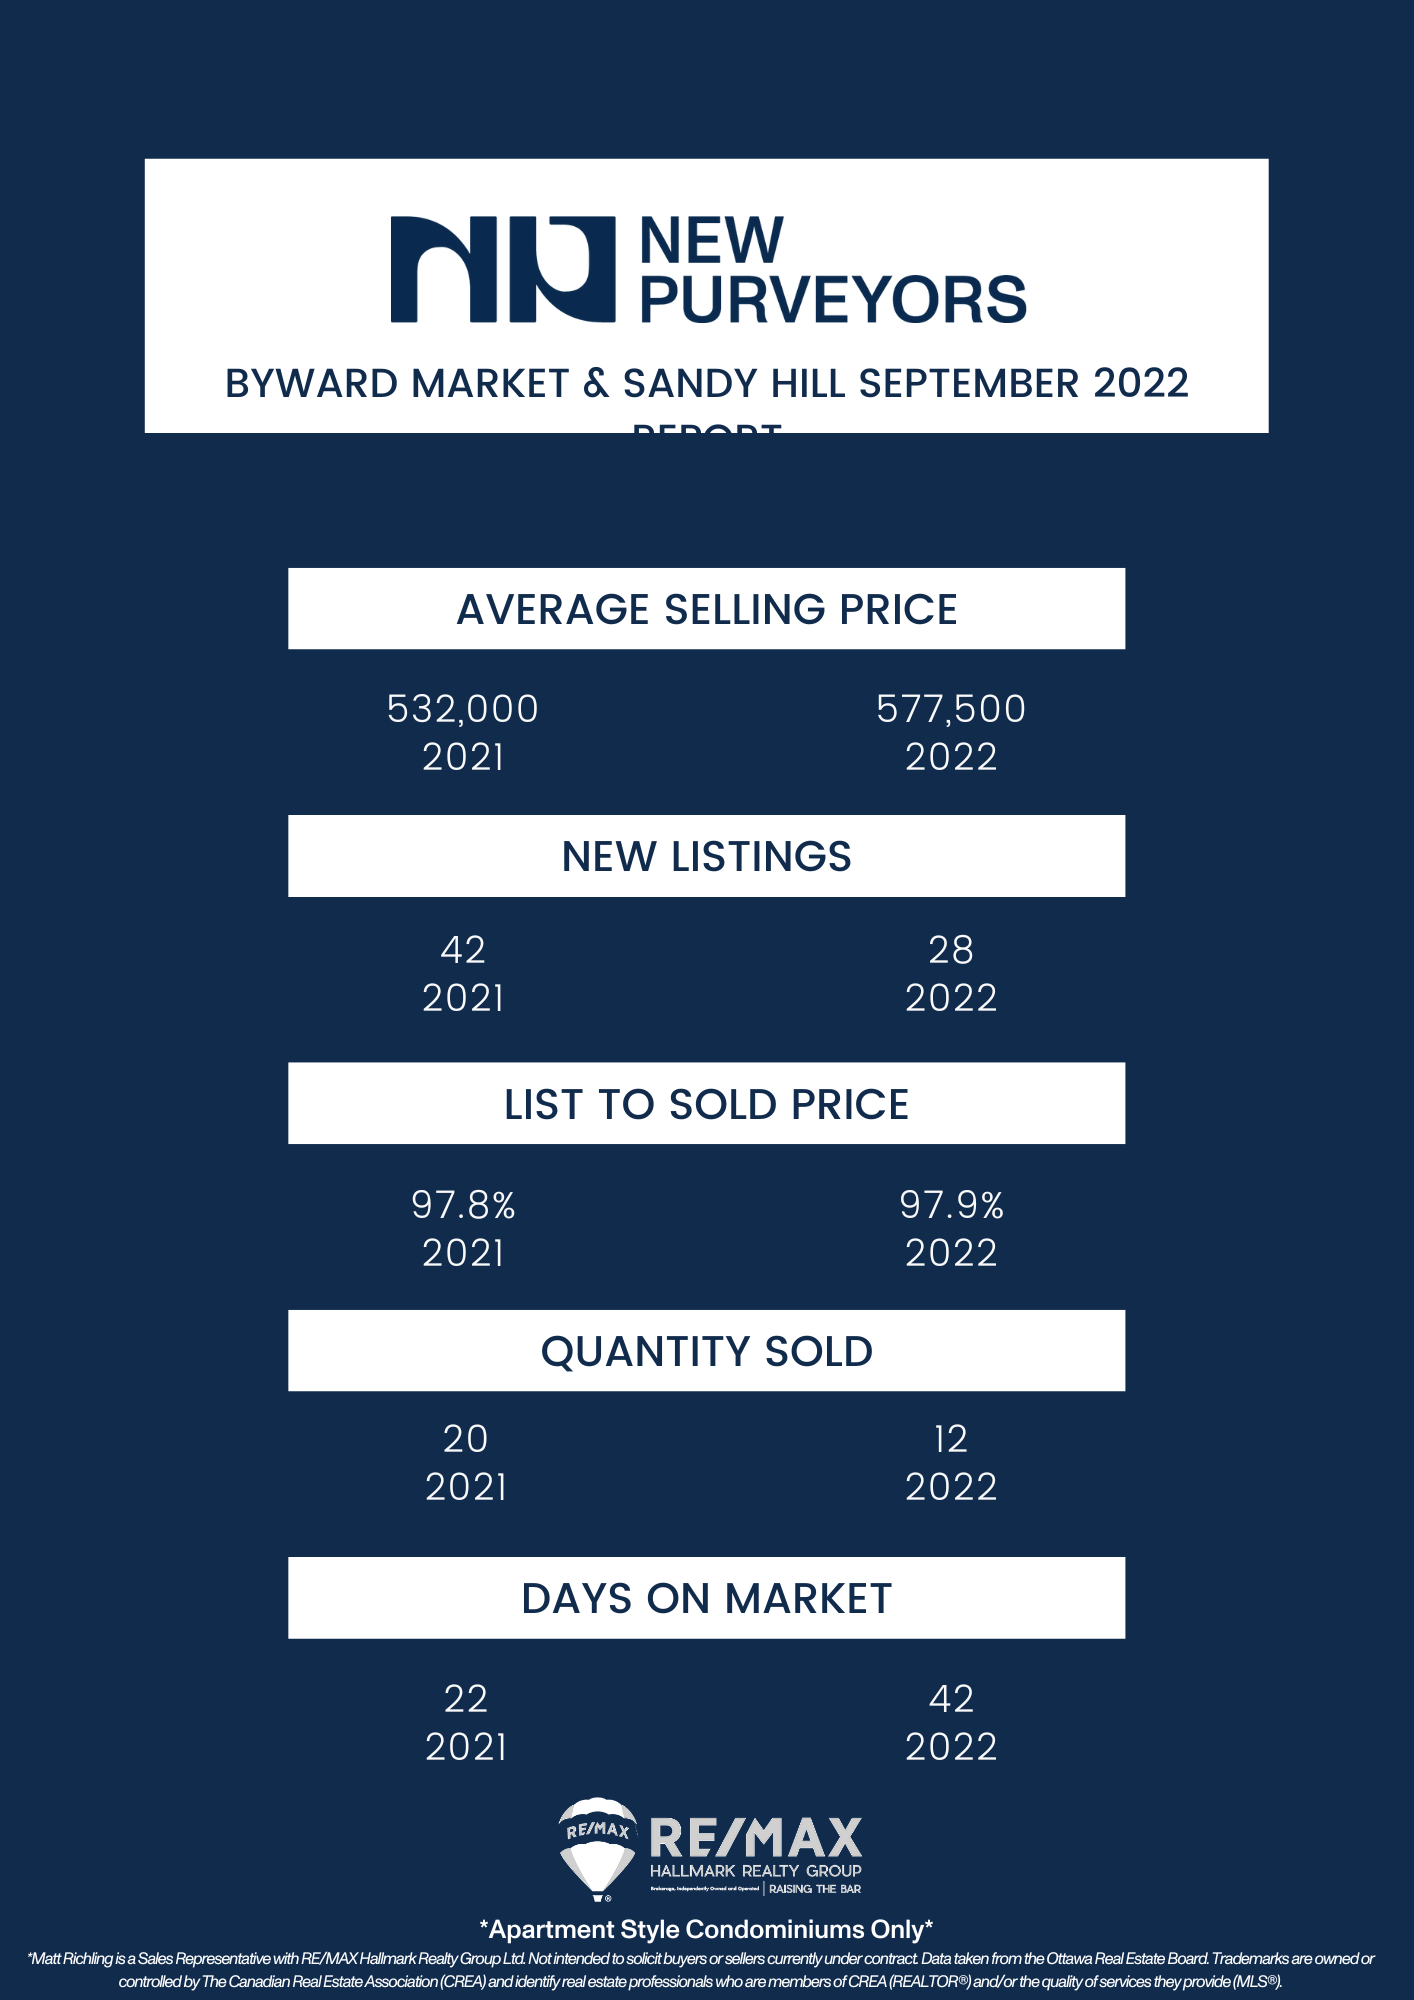
Every month we take a closer look and drill down the sales data of Ottawa condos from the previous month. Here are the statistics for September 2022 in the top five "downtown" areas - Centretown, Byward Market and Sandy Hill, Little Italy (which includes Lebreton Flats), Hintonburg, and Westboro. The information will be specific to apartment-style condominiums, and only what sold through the MLS. Also important to note that DOM (Day's On Market) is calculated to include the conditional period, which in Ottawa is roughly 14 days for almost every single transaction.
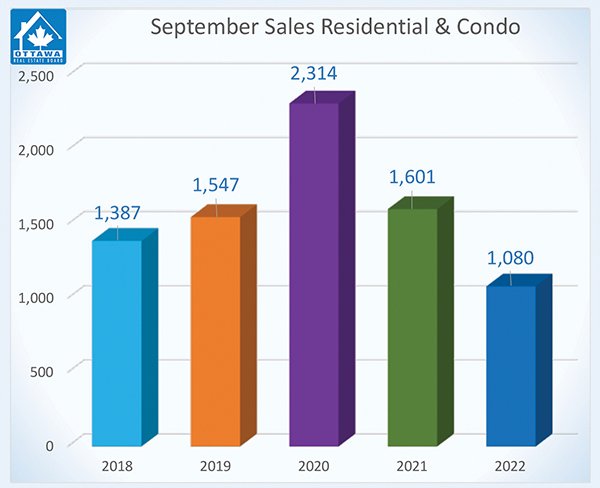
This month, Ottawa real estate agents sold a total of 1080 properties, down 33% compared to September last year. The decrease is higher in residential properties, down 34%, than it is in condos, down 27%. This is also significantly lower than the 5 year average of 1586.
This is illustrative of buyer’s hesitancy about rising interest rates, OREB’s president Penny Torontow says. The mortgage stress test and inflation in the country has caused a lot of buyers to stop their search for the time being.
However, we’ve seen an increase of new listings that have entered the market! These are now higher than not only last month, but also last year, and the five year average. This means that the market is coming closer into balance. Buyers and sellers can now take the time to weigh their options and see what works best for their situation.
Inventory in residential properties is up to 3.1 months. It was 1.2 this time last year! For condos, we’re seeing 2.7 months inventory compared to 1.6 last year. New listings are 5% higher than in 2021 and 13% higher than this August.
We are also seeing prices begin to stabilize month to month, but are still increasing in yearly trends. Average condo prices are up 6% from 2021 to $450,987. Residential properties are up an average of 0.5% at $706,658.
Important to note is that these statistics can only be as accurate as there are condos sold in Ottawa. The more condos sold in an area, the more accurate the averages will be.
Want to chat about your options? Fill out the form at the bottom of the page, or text/call us directly 613-900-5700 or fill out the form at the bottom of the page.
Do you have any questions about how this information affects your investment or looking for more information to make the best decision about your purchase? Let’s chat! Fill out the form on the bottom of the page.