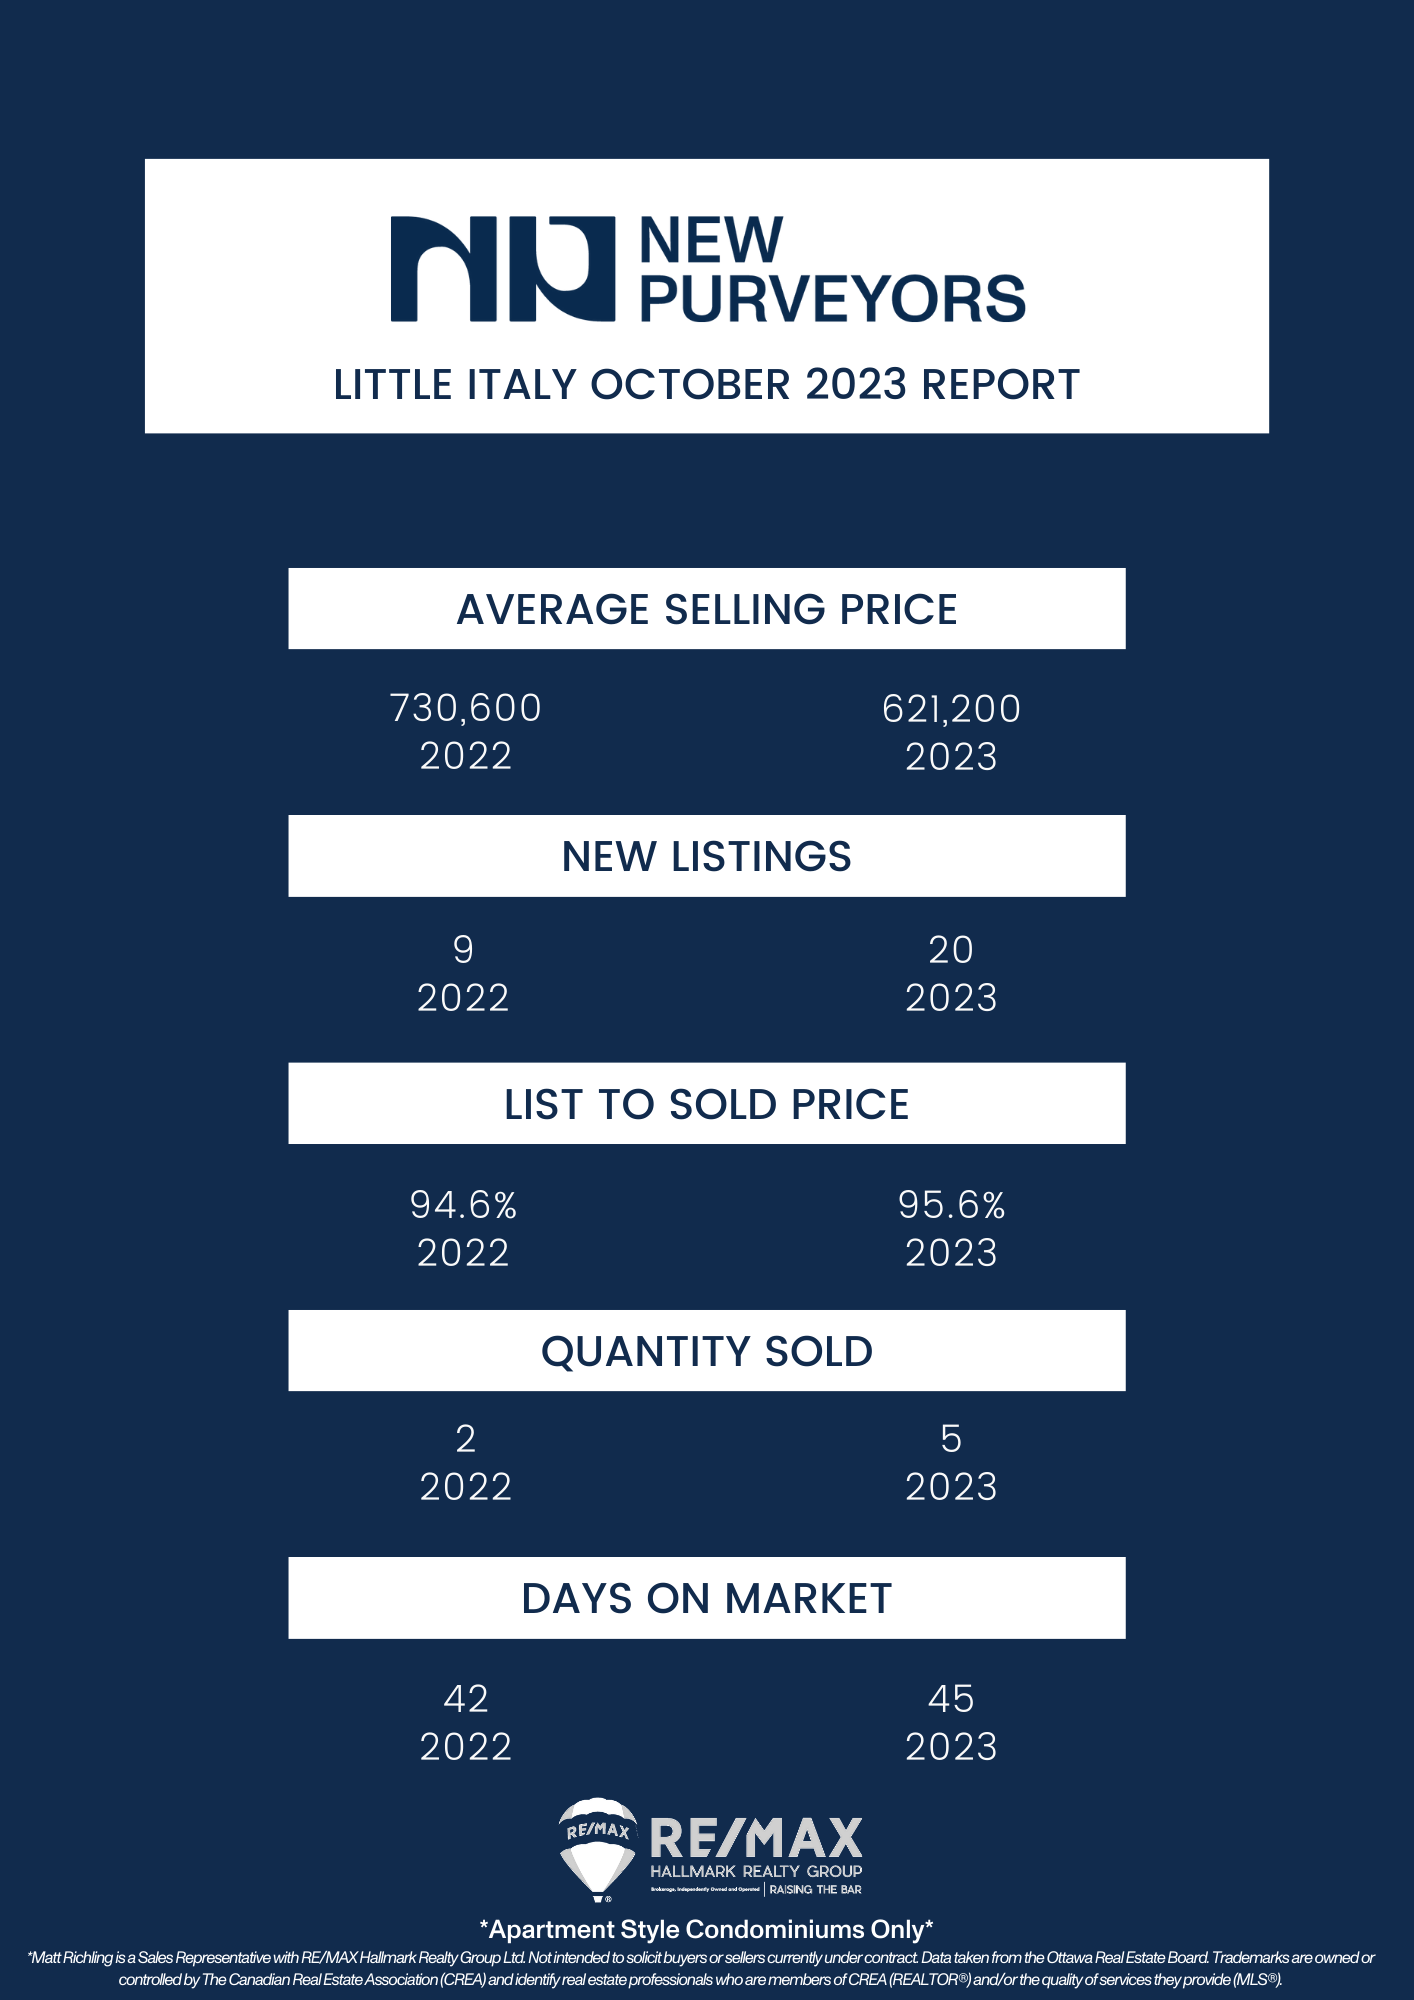
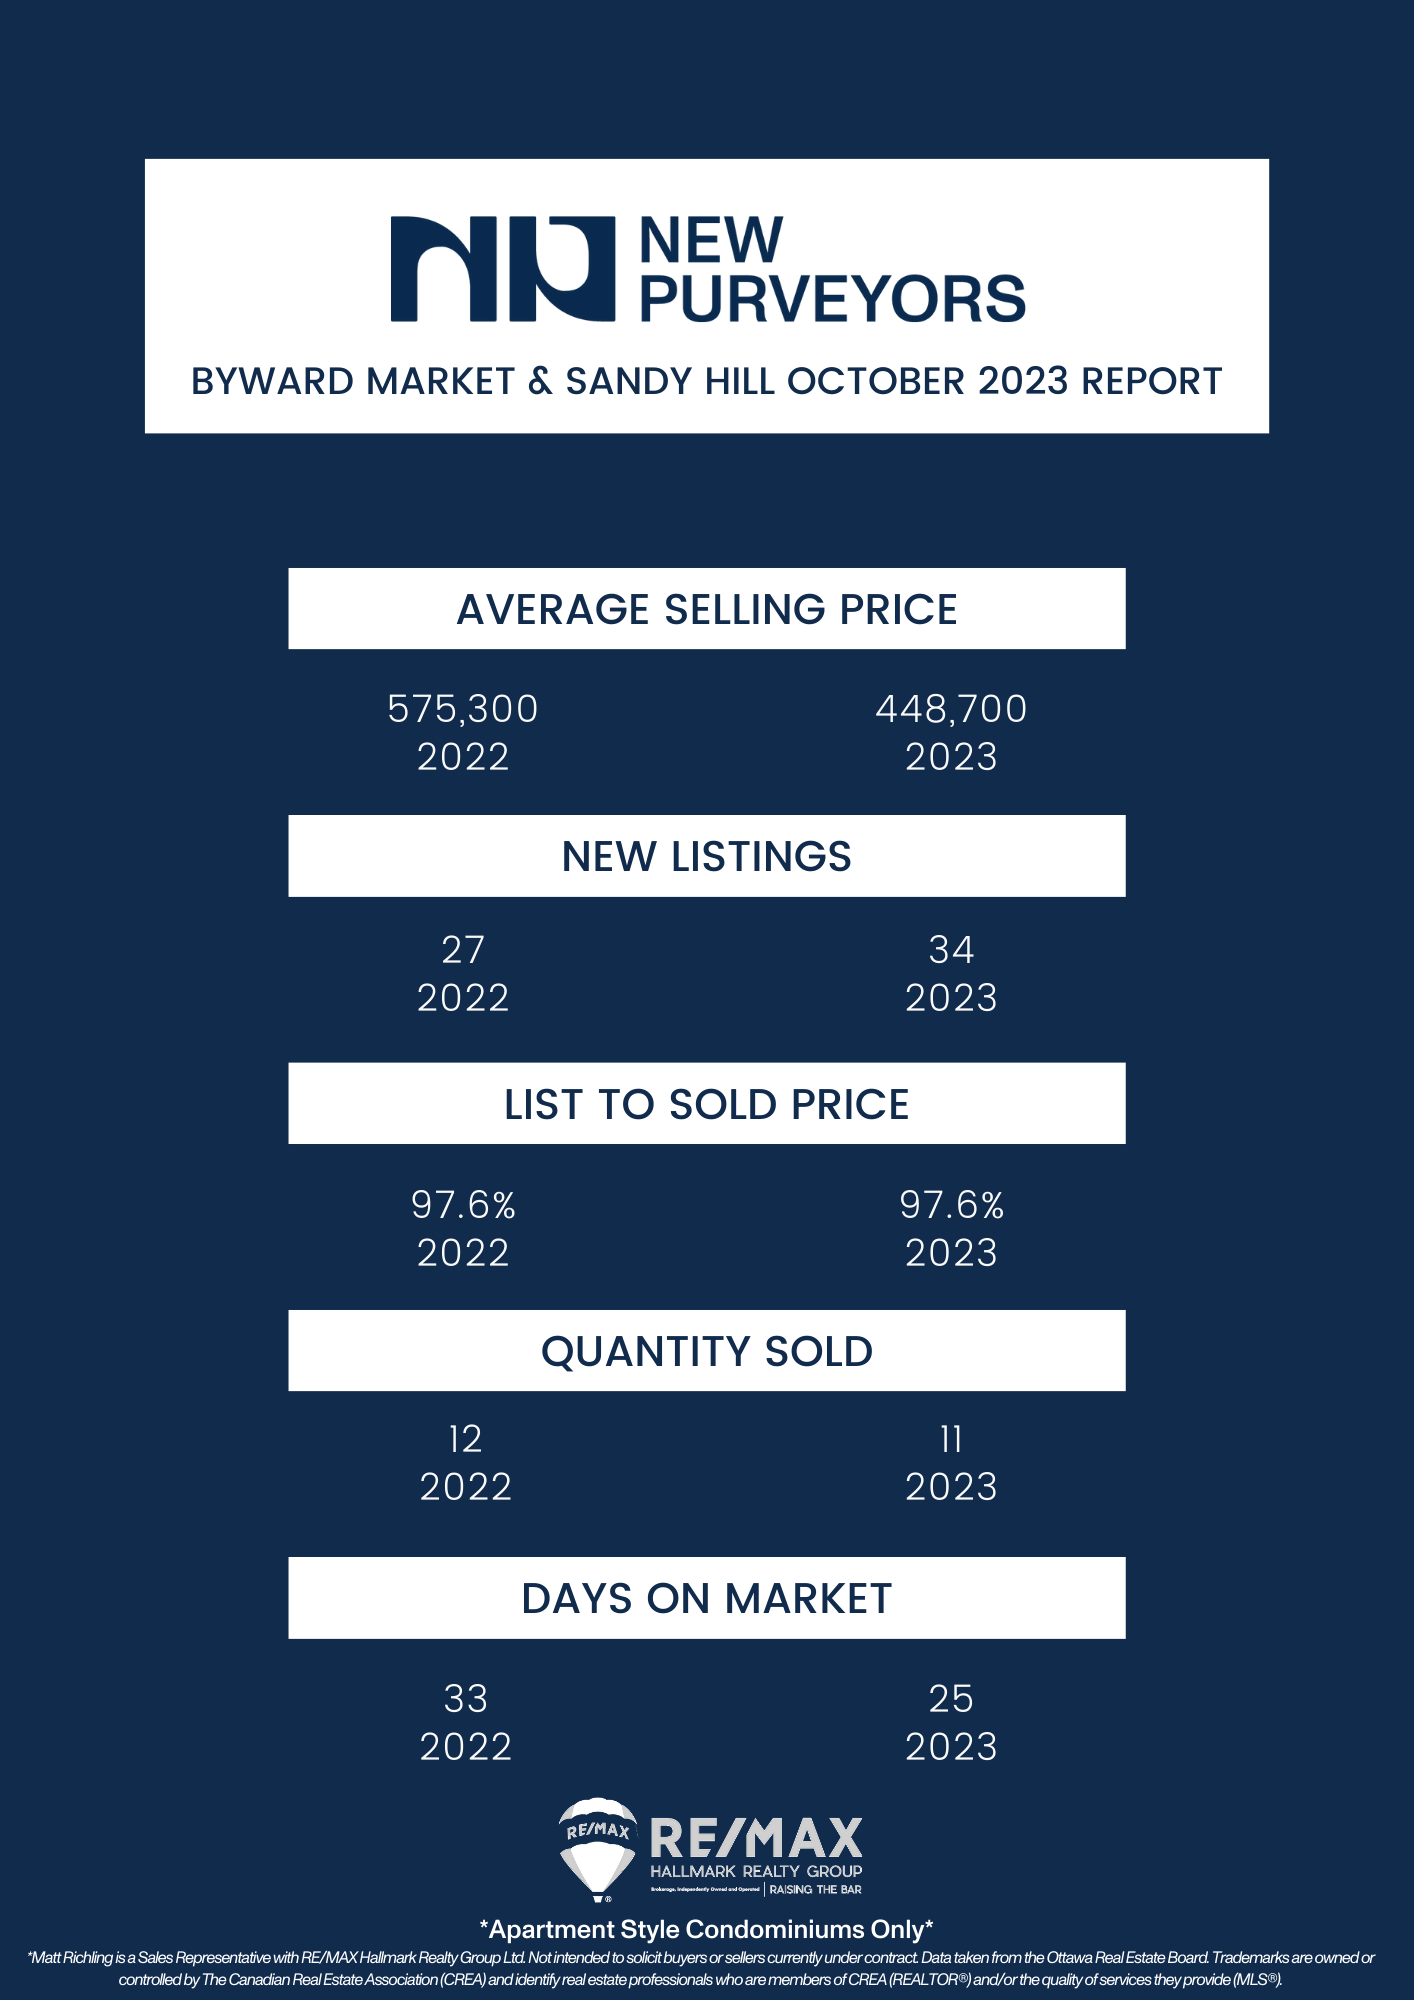
Every month we take a closer look and drill down the sales data of Ottawa condos from the previous month. Here are the statistics for October 2023 in the top five "downtown" areas - Centretown, Byward Market and Sandy Hill, Little Italy (which includes Lebreton Flats), Hintonburg, and Westboro. The information will be specific to apartment-style condominiums, and only what is sold through the MLS. Also important to note that DOM (Day's On Market) is calculated to include the conditional period, which in Ottawa is roughly 14 days for almost every single transaction.
The Ottawa Real Estate Board totalled for a number of 816 units sold in October 2023. This was 2.7% less than in October 2022.
Home sales were 36.4% under the five-year average, and 30.8% under the 10-year average in the month of October.
Home sales totalled 10,700 units over the first 10 months of the year. This was a huge decline of 12.3 percent from the same period in 2022.
Ken Dekker, the President of OREB, suggests that the increasing cost of living may be causing both buyers and sellers to stay where they are. He notes a gradual decline in sales activity, which is expected for this time of year. Prices are also adjusting, with certain types of homes, such as apartments, experiencing higher sales compared to the previous October. Although Ottawa's inventory is slowly growing, persistent supply issues continue to create a lingering demand. Despite the current slowdown, Ken Dekker emphasizes that it's an opportune moment for buyers to act before the market shifts from a balanced state to one favouring sellers.

By the numbers:
The MLS Home Price Index (HPI) tracks price trends by using average or median price measures.
The overall MLS HPI price for October 2023 remained relatively steady at 638,600, with a modest 1.8% increase compared to October 2022.
The price for single-family homes in September was 721,600, showing a 2.2% year-on-year increase.
For reference, the average price of a townhouse stood at 501,100, marking a slight 1% rise from the previous year.
The average price of apartments remained unchanged at 424,100 compared to a year ago.
In October 2023, the average price of homes sold reached 660,836, reflecting a 2.9% increase from October 2022. Meanwhile, the more comprehensive average price amounted to 671,983, indicating a 5.9% decrease in comparison to the first ten months of 2022.
The total value of all home sales in October 2023 was 539.2 million, which was identical to the figure for the same month last year.
Inventory and New Listings
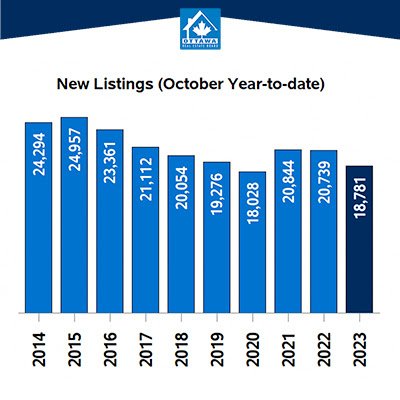
In October 2023, the volume of new property listings increased by 6.6% compared to October 2022, reaching a total of 1,895 new residential listings. These new listings exceeded the five-year average by 2% and the 10-year average by 5.4% for the month of October.
By the end of October, there were 3,062 active residential listings on the market, marking a significant increase of 16.7% since October 2022. This level of active listings in October hasn't been seen in over five years. Active listings were 43.8% above the five-year average and 10.9% below the 10-year average for the month of October.
At the close of October 2023, there were 3.8 months of inventory, a slight increase from the 3.1 months recorded in October 2022. The months of inventory represent the estimated time it would take to sell the current inventory at the present rate of sales activity.

Important to note is that these statistics can only be as accurate as there are condos sold in Ottawa. The more condos sold in an area, the more accurate the averages will be.
Want to chat about your options? Fill out the form at the bottom of the page, or text/call us directly 613-900-5700 or fill out the form at the bottom of the page.
Do you have any questions about how this information affects your investment or looking for more information to make the best decision about your purchase? Let’s chat! Fill out the form on the bottom of the page.