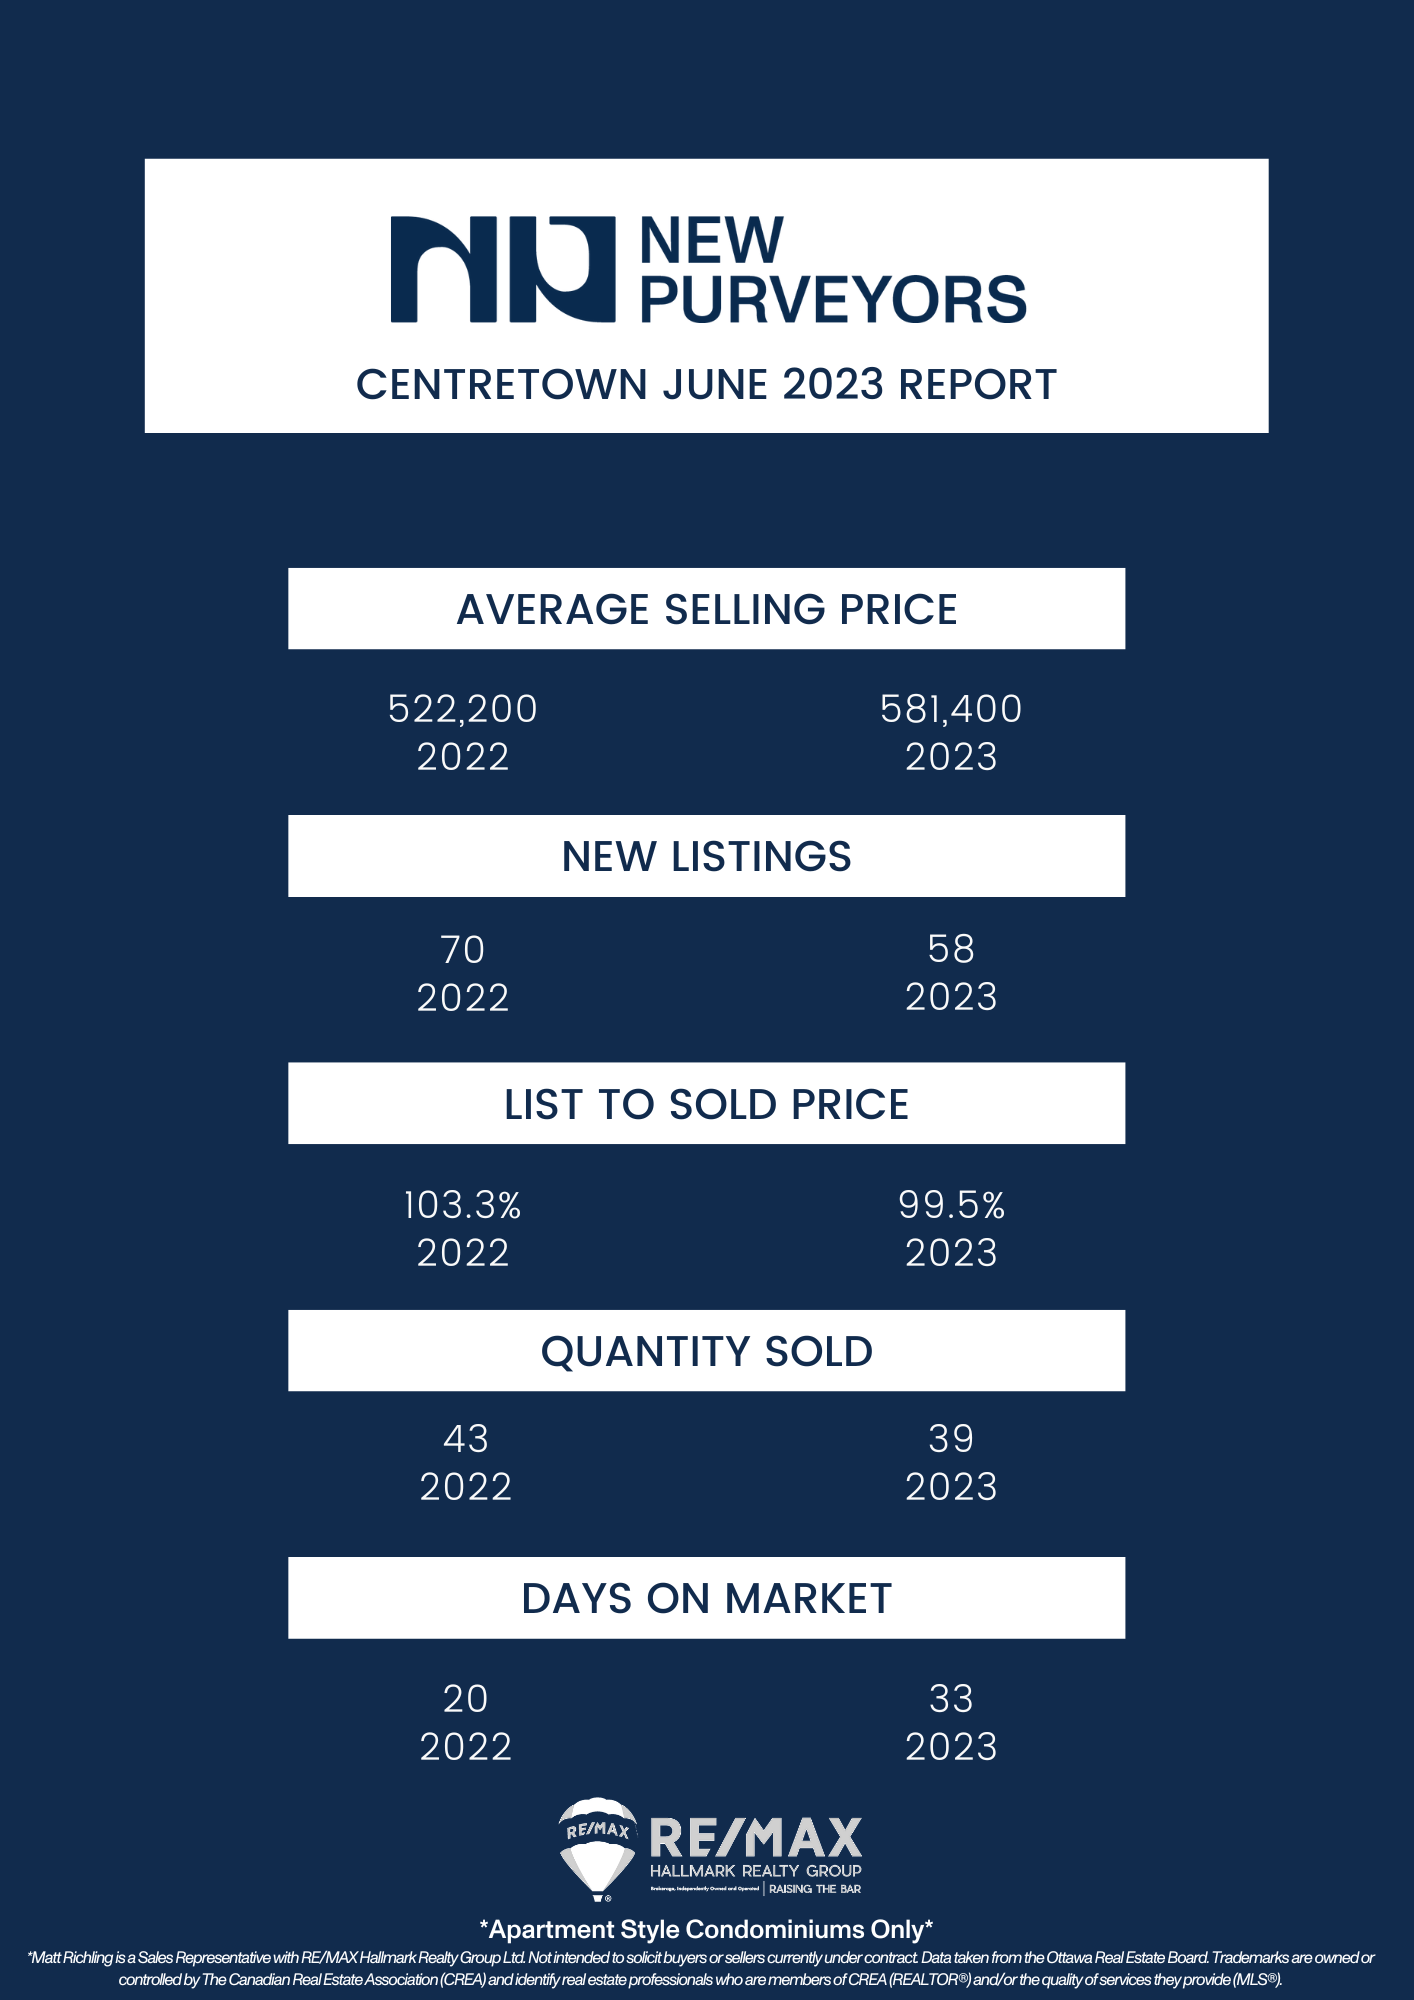
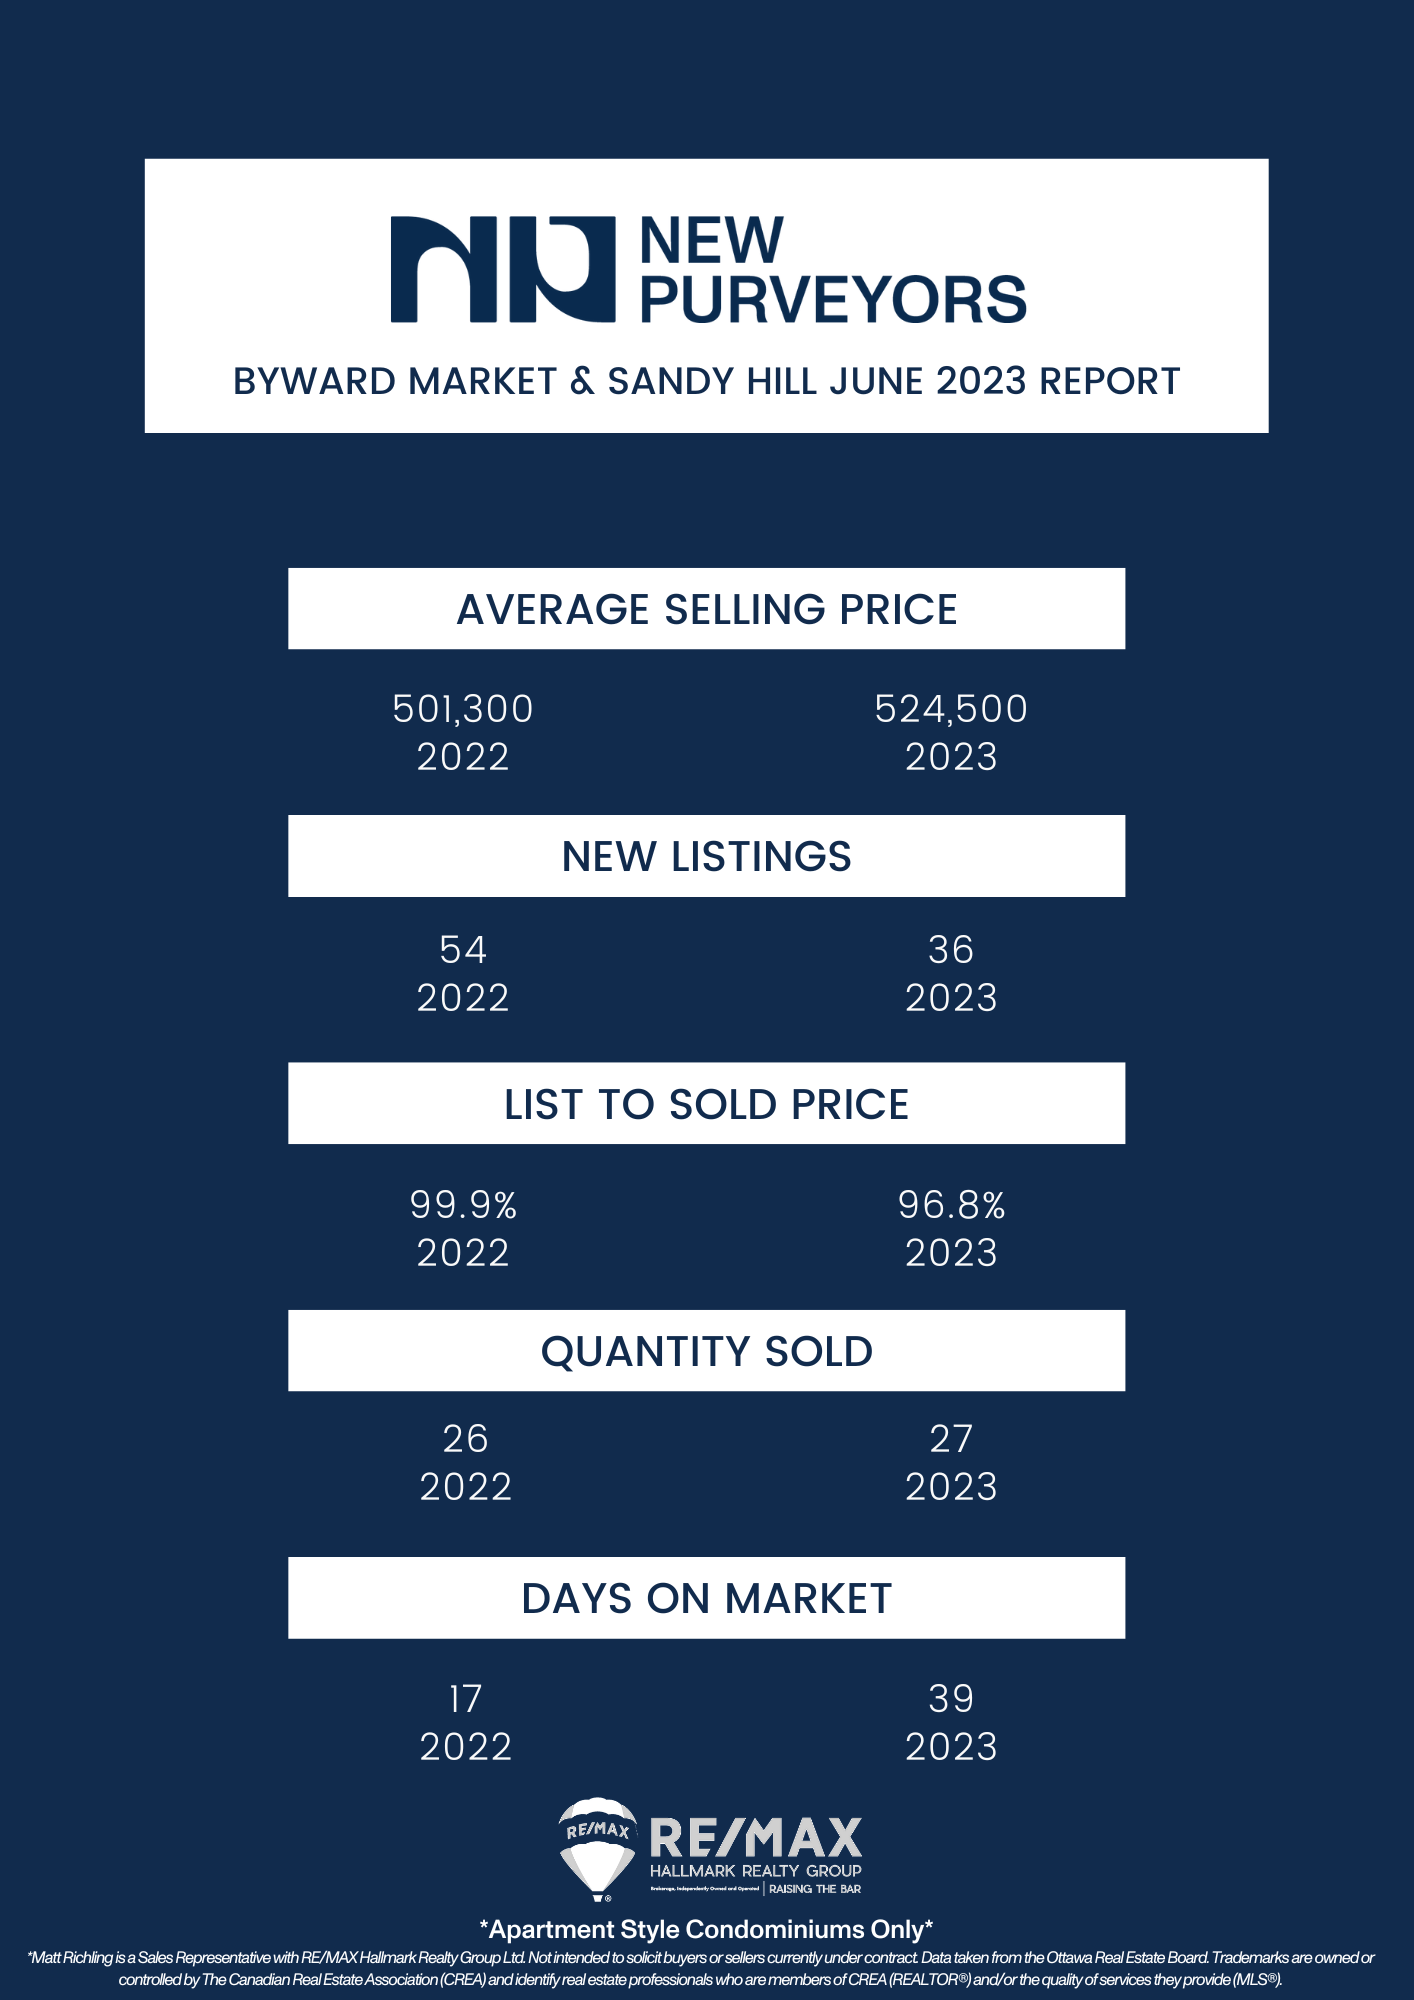
Every month we take a closer look and drill down the sales data of Ottawa condos from the previous month. Here are the statistics for June 2023 in the top five "downtown" areas - Centretown, Byward Market and Sandy Hill, Little Italy (which includes Lebreton Flats), Hintonburg, and Westboro. The information will be specific to apartment-style condominiums, and only what sold through the MLS. Also important to note that DOM (Day's On Market) is calculated to include the conditional period, which in Ottawa is roughly 14 days for almost every single transaction.
In June, Ottawa Real Estate Board (OREB) members sold 1,658 residential properties through the Board's MLS® System, marking an 11% increase from June 2022’s 1,493 sold properties. Within this, 1,234 were freehold, a 10% increase from last year, and 424 condominium properties were sold, a 16% increase from June 2022. The five-year average for total unit sales in June is 1,881.
OREB President Ken Dekker stated that while June's sales exceeded last year's, the number of sales, average prices, and new listings declined on a week-to-week basis throughout the month. The summer decline in activity combined with the Bank of Canada's interest rate adjustment at the beginning of the month may have contributed to this trend.

The average sale price for a freehold property in June was $746,445, showing a 4% decrease from 2022 but remaining consistent with May 2023 prices. The average sale price for a condominium property was $448,380, a 2% increase from the previous year and a 1% increase from May 2023 prices. Year-to-date average sale prices for freehold properties are $731,847, reflecting a 10% decrease from 2022, while average sale prices for condominiums are $432,885, indicating a 7% decrease from the previous year.
Dekker expressed optimism about the increase in inventory, which suggests sellers have confidence in the market. This growing resale housing stock is expected to provide more options for buyers and contribute to increased sales.
In terms of inventory and new listings, June's new listings amounted to 2,758, which is 14% lower than June 2022 and 2% lower than May 2023. The five-year average for new listings in June is 2,802. Months of inventory for freehold properties increased to 2.1 months from 1.9 months in June 2022 and 1.5 months in May 2023. For condominium properties, months of inventory decreased to 1.4 months from 1.6 months in June 2022 but increased compared to 1.3 months in May 2023. The days on market (DOM) for freehold properties remained at 23 days, while for condos, it increased to 27 days from the previous month's 26 days.
Dekker anticipates a strong second half of 2023 in terms of sales volume and prices compared to last year.
OREB Members have also assisted clients in renting properties, with 3,336 rentals facilitated since the beginning of the year, marking a 14% increase from the same period last year when 2,919 rentals were arranged.

Important to note is that these statistics can only be as accurate as there are condos sold in Ottawa. The more condos sold in an area, the more accurate the averages will be.
Want to chat about your options? Fill out the form at the bottom of the page, or text/call us directly 613-900-5700 or fill out the form at the bottom of the page.
Do you have any questions about how this information affects your investment or looking for more information to make the best decision about your purchase? Let’s chat! Fill out the form on the bottom of the page.