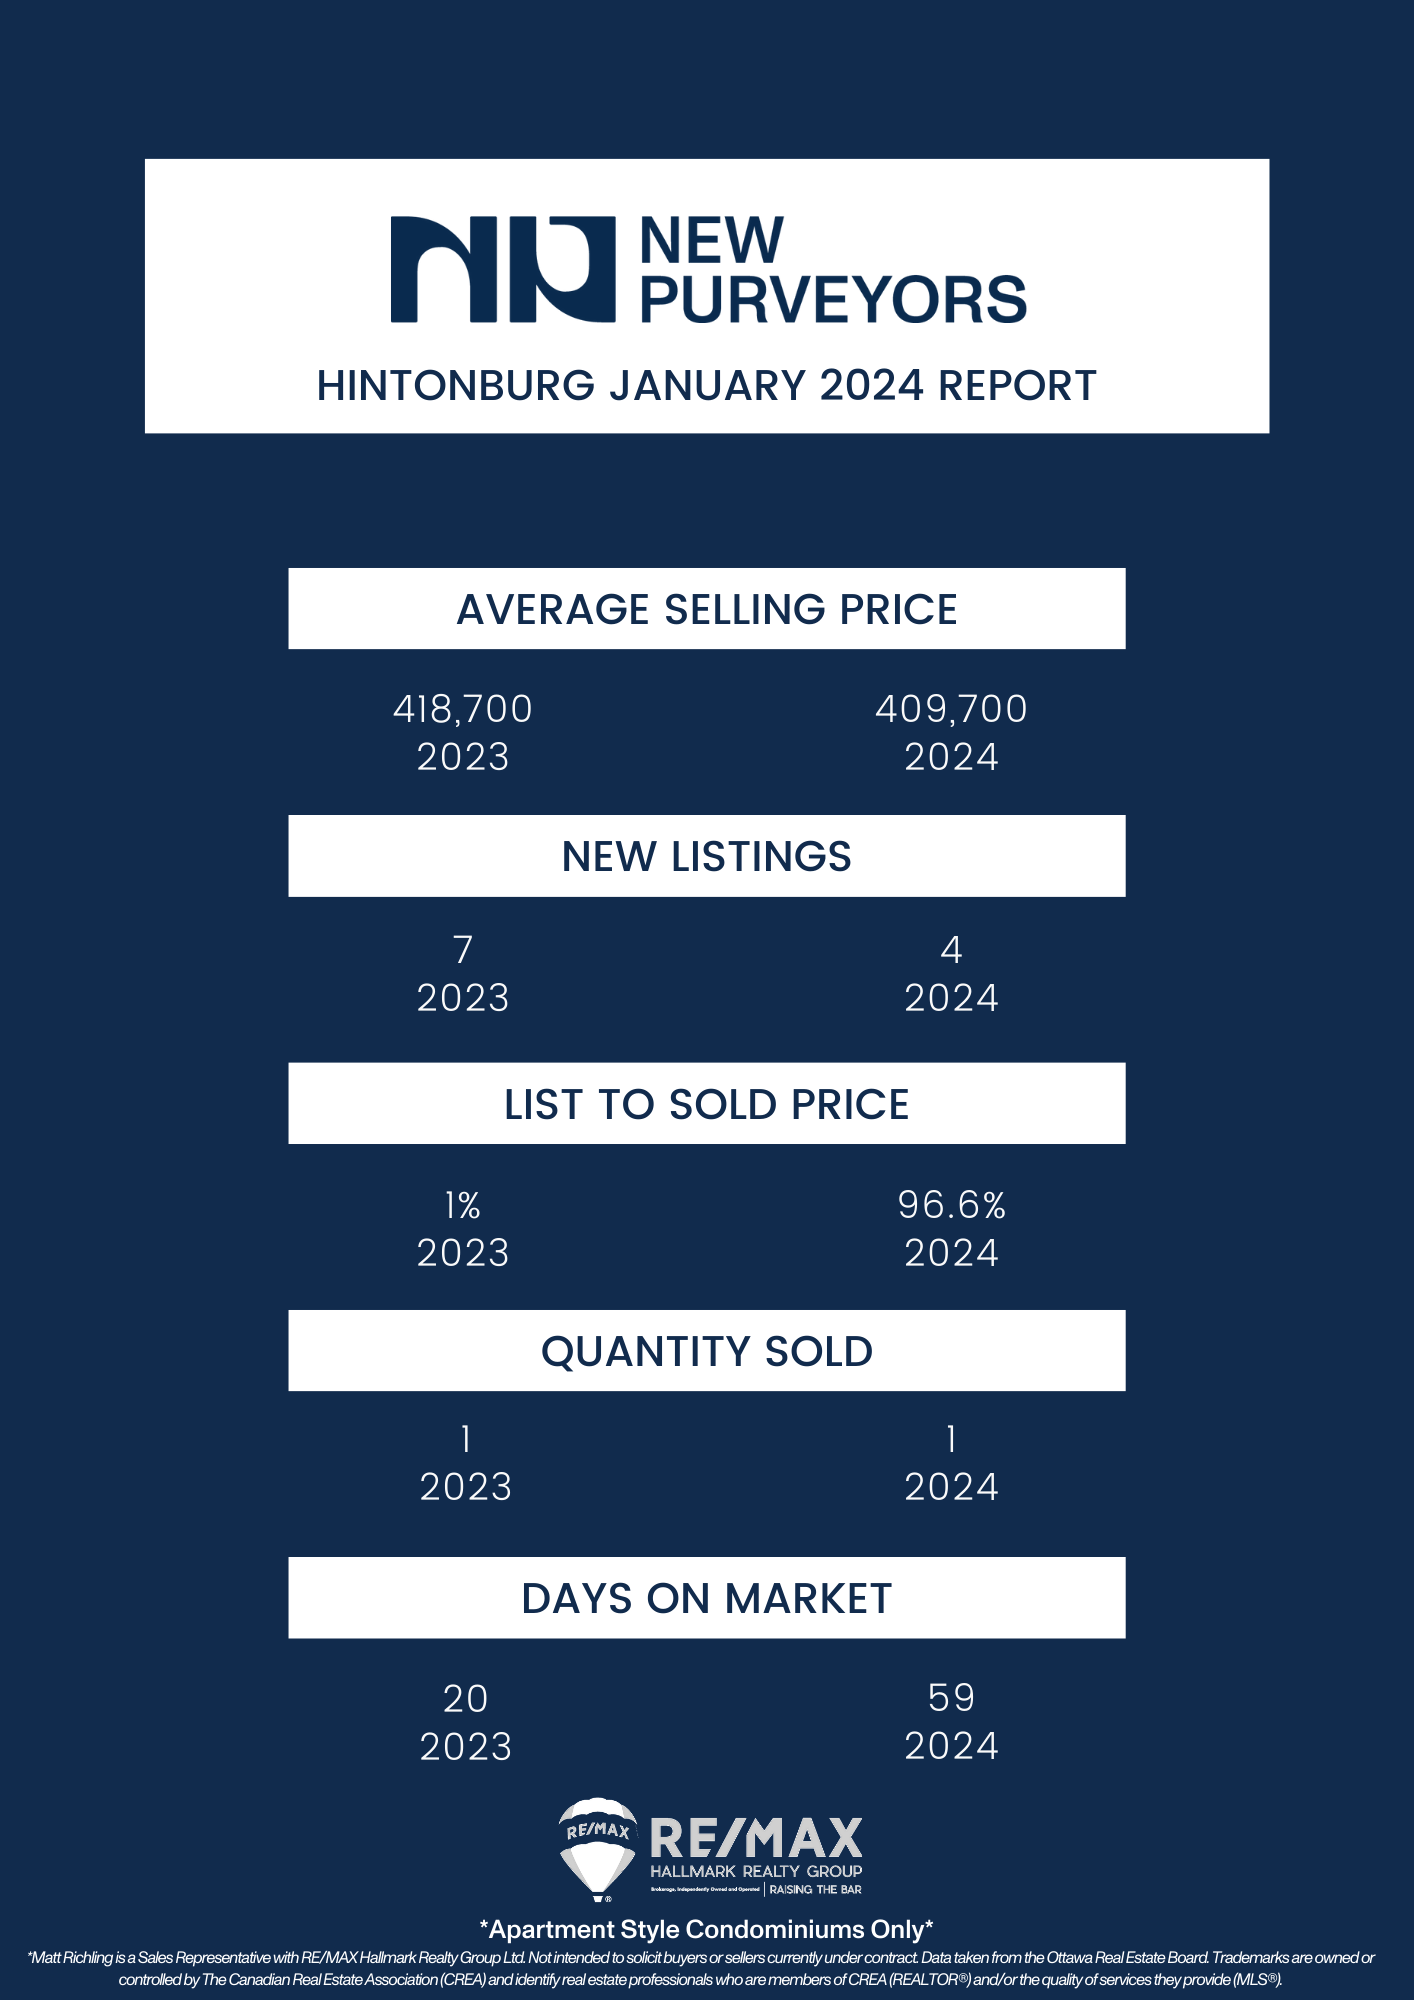
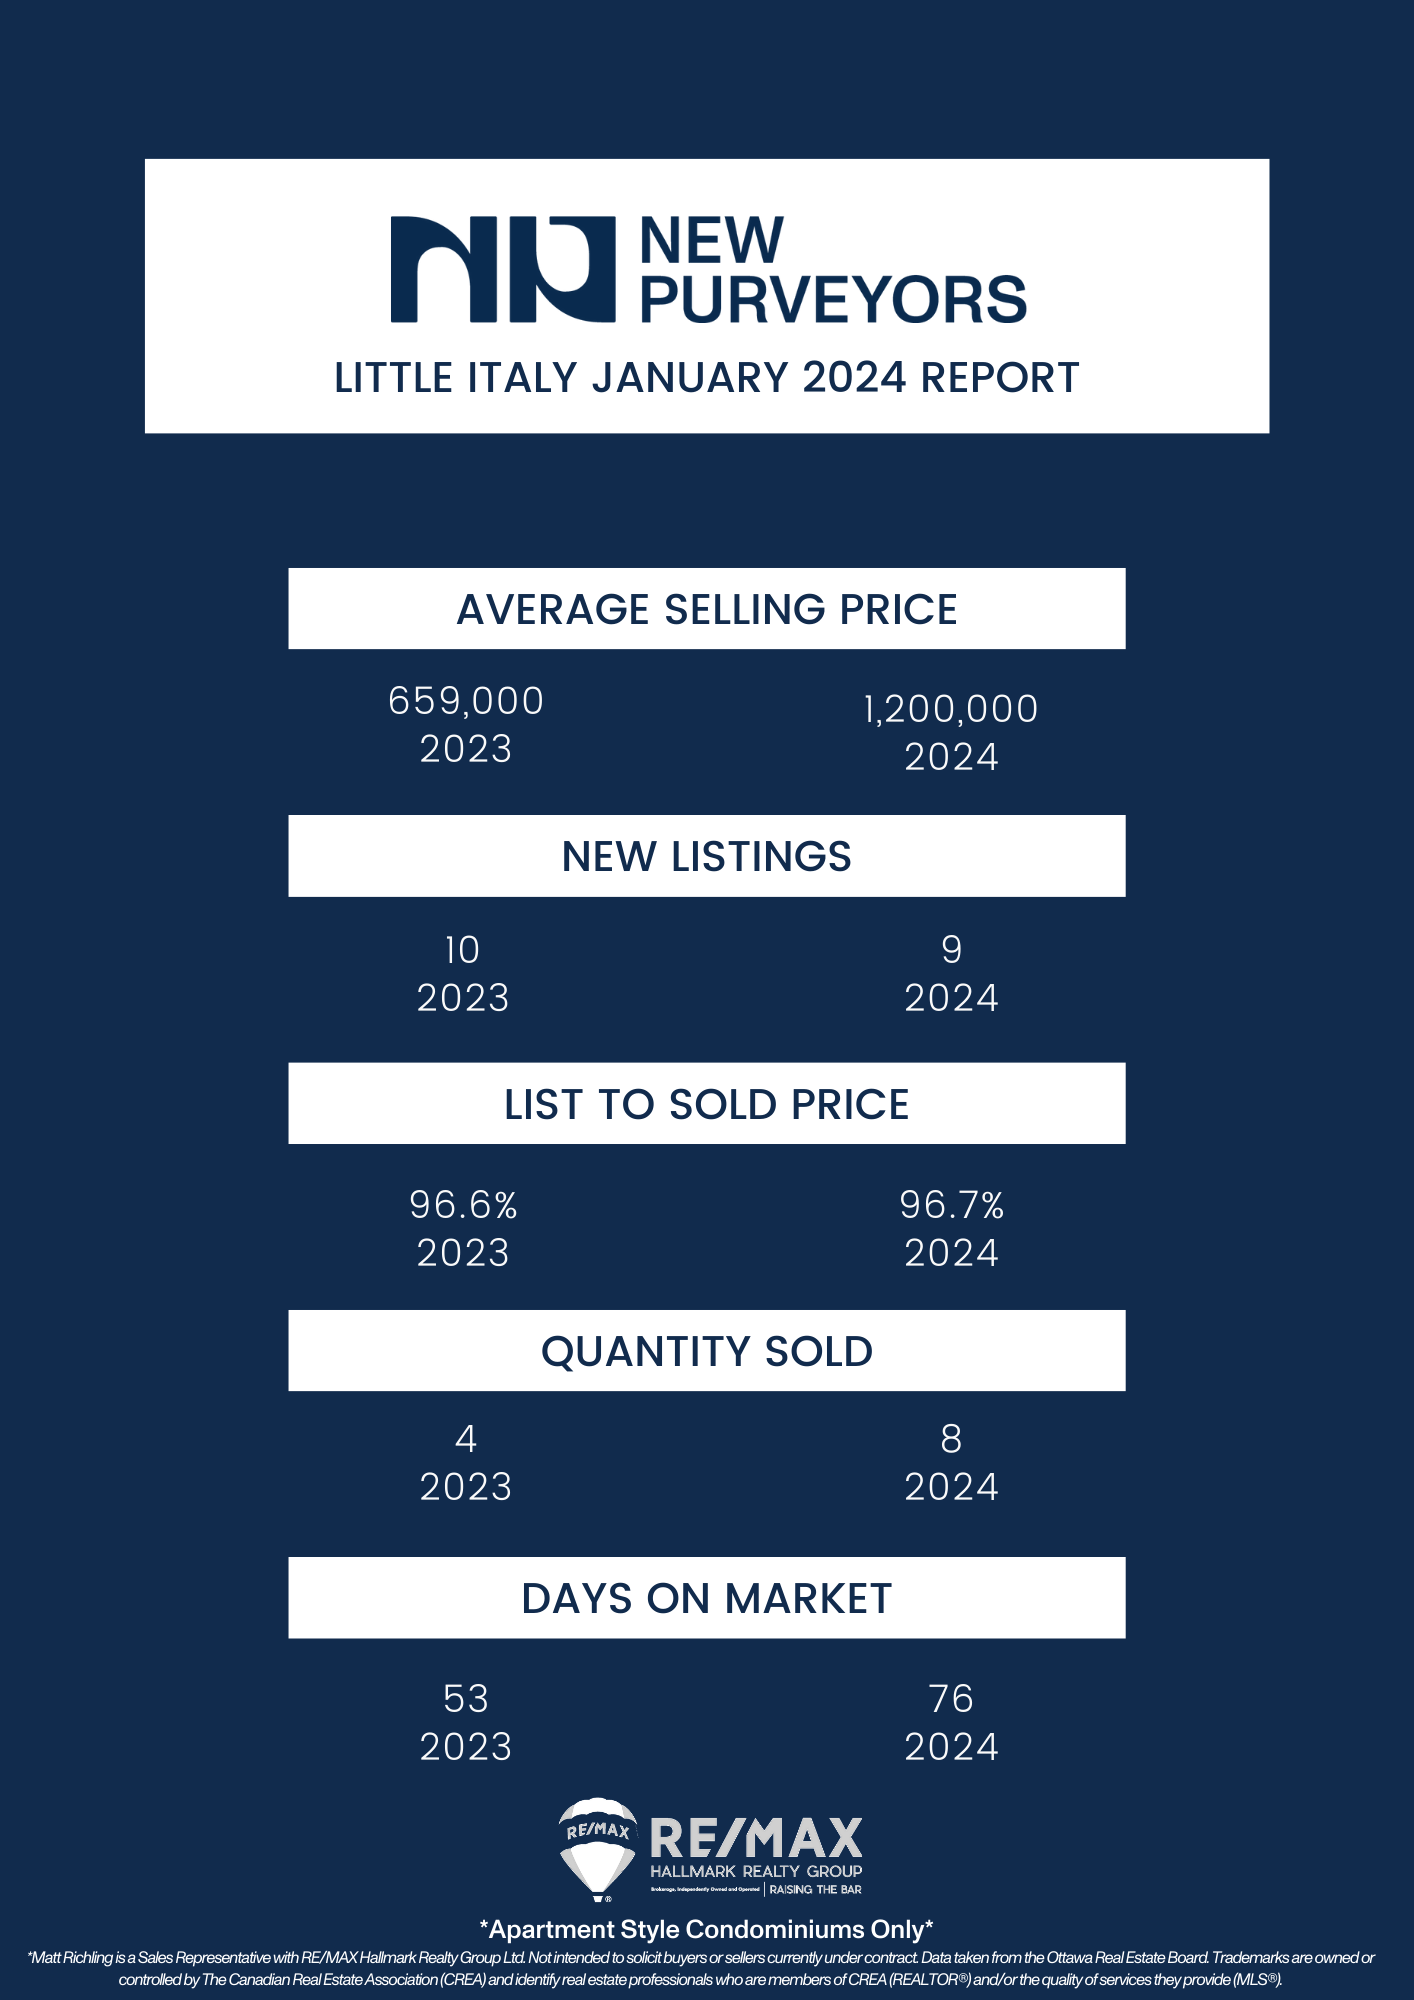
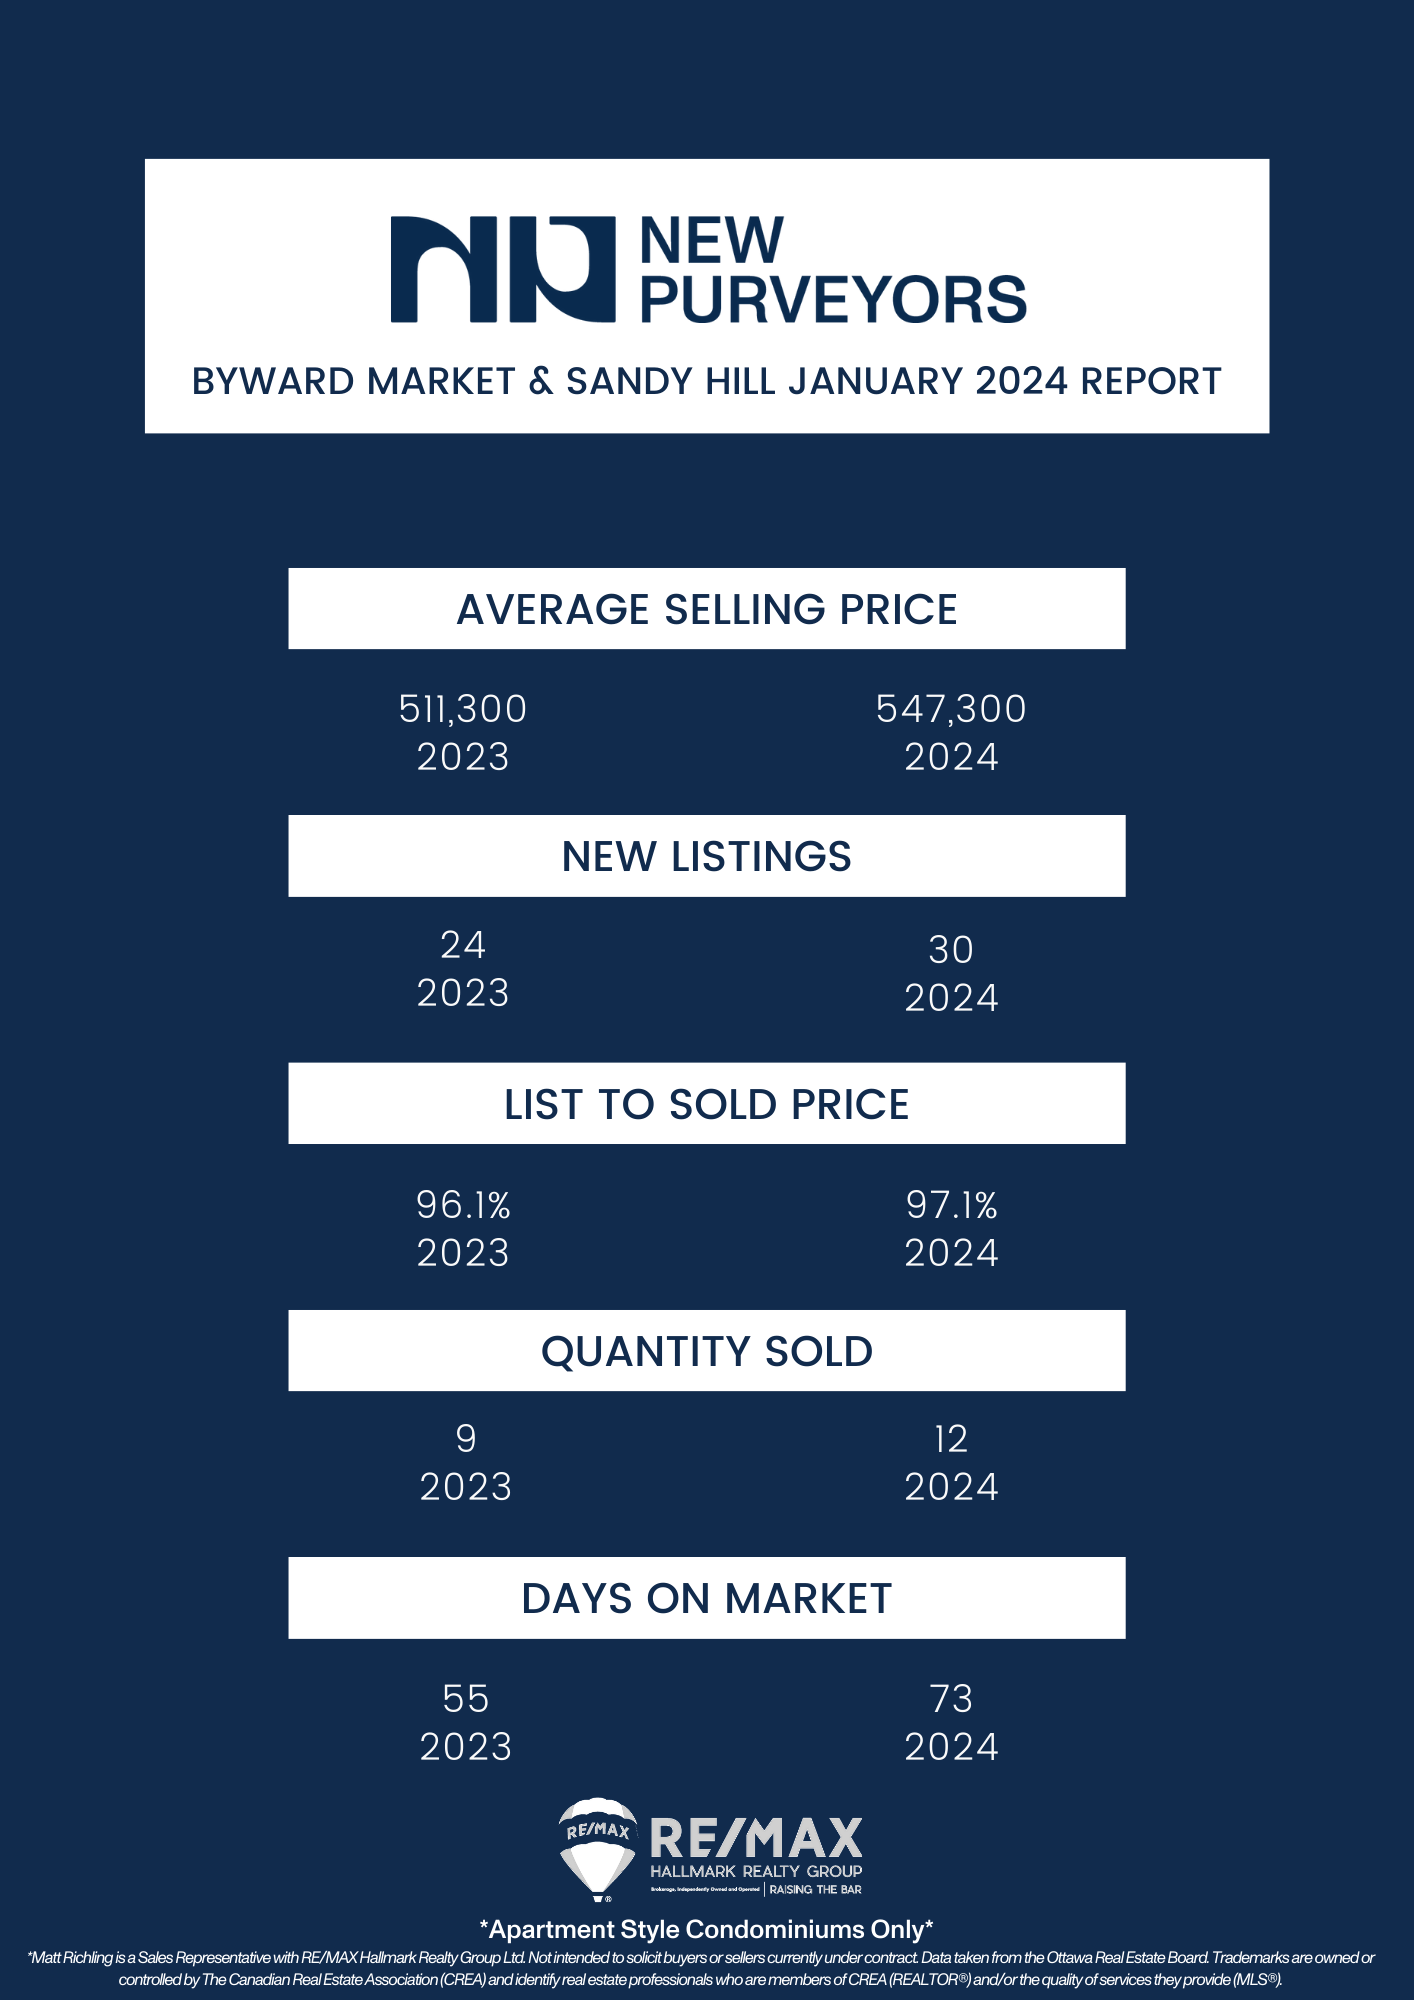
Every month we take a closer look and drill down the sales data of Ottawa condos from the previous month. Here are the statistics for January 2024 in the top five "downtown" areas - Centretown, Byward Market and Sandy Hill, Little Italy (which includes Lebreton Flats), Hintonburg, and Westboro. The information will be specific to apartment-style condominiums, and only what is sold through the MLS. Also important to note that DOM (Day's On Market) is calculated to include the conditional period, which in Ottawa is roughly 14 days for almost every single transaction.
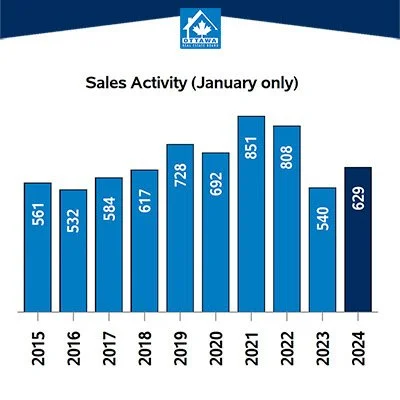
In January 2024, the Ottawa Real Estate Board (OREB) reported a total of 629 homes sold via the MLS® System, marking a 16.5% increase from the same period in 2023.
Despite this uptick, home sales were 10.7% below the five-year average and 3.9% below the ten-year average for January, reflecting a relatively subdued market, according to OREB President Curtis Fillier. He noted an increase in showing activity but cautioned that it hasn't fully translated into sales, suggesting that buyers are cautiously exploring options, unlike the pandemic era when swift decisions were often necessary.
OREB's policy and external relations manager, Brandon Reay, highlighted the persistent issue of low housing supply in Ottawa, stressing the need for more affordable housing options and increased density to meet population demands. He advocated for policy changes, including streamlining processes at the Ontario Land Tribunal, eliminating exclusionary zoning, and allowing four units on residential lots.
Regarding pricing trends, the MLS® Home Price Index (HPI) indicated a 3.2% year-over-year increase in the overall benchmark price to $621,600 in January 2024. Single-family homes saw a 3.7% increase to $703,500, while townhouses/row units experienced a 2.1% decrease to $462,200. The benchmark apartment price rose by 3.7% to $418,500.
In terms of average prices, homes sold for an average of $631,722 in January 2024, up 1.8% from the previous year. The total dollar volume of home sales also rose by 18.6% to $397.4 million compared to January 2023.


The number of new residential listings in January 2024 increased by 7.3% compared to the same month in 2023, totaling 1,271 listings. Active residential listings at the end of January 2024 numbered 1,961 units, up 4.5% from January 2023.
Inventory levels saw a slight decrease, with the months of inventory dropping to 3.1 in January 2024 from 3.5 in January 2023. Months of inventory represent the time it would take to sell the current inventory at the current sales rate.
Important to note is that these statistics can only be as accurate as there are condos sold in Ottawa. The more condos sold in an area, the more accurate the averages will be.
Want to chat about your options? Fill out the form at the bottom of the page, or text/call us directly 613-900-5700 or fill out the form at the bottom of the page.
Do you have any questions about how this information affects your investment or looking for more information to make the best decision about your purchase? Let’s chat! Fill out the form on the bottom of the page.