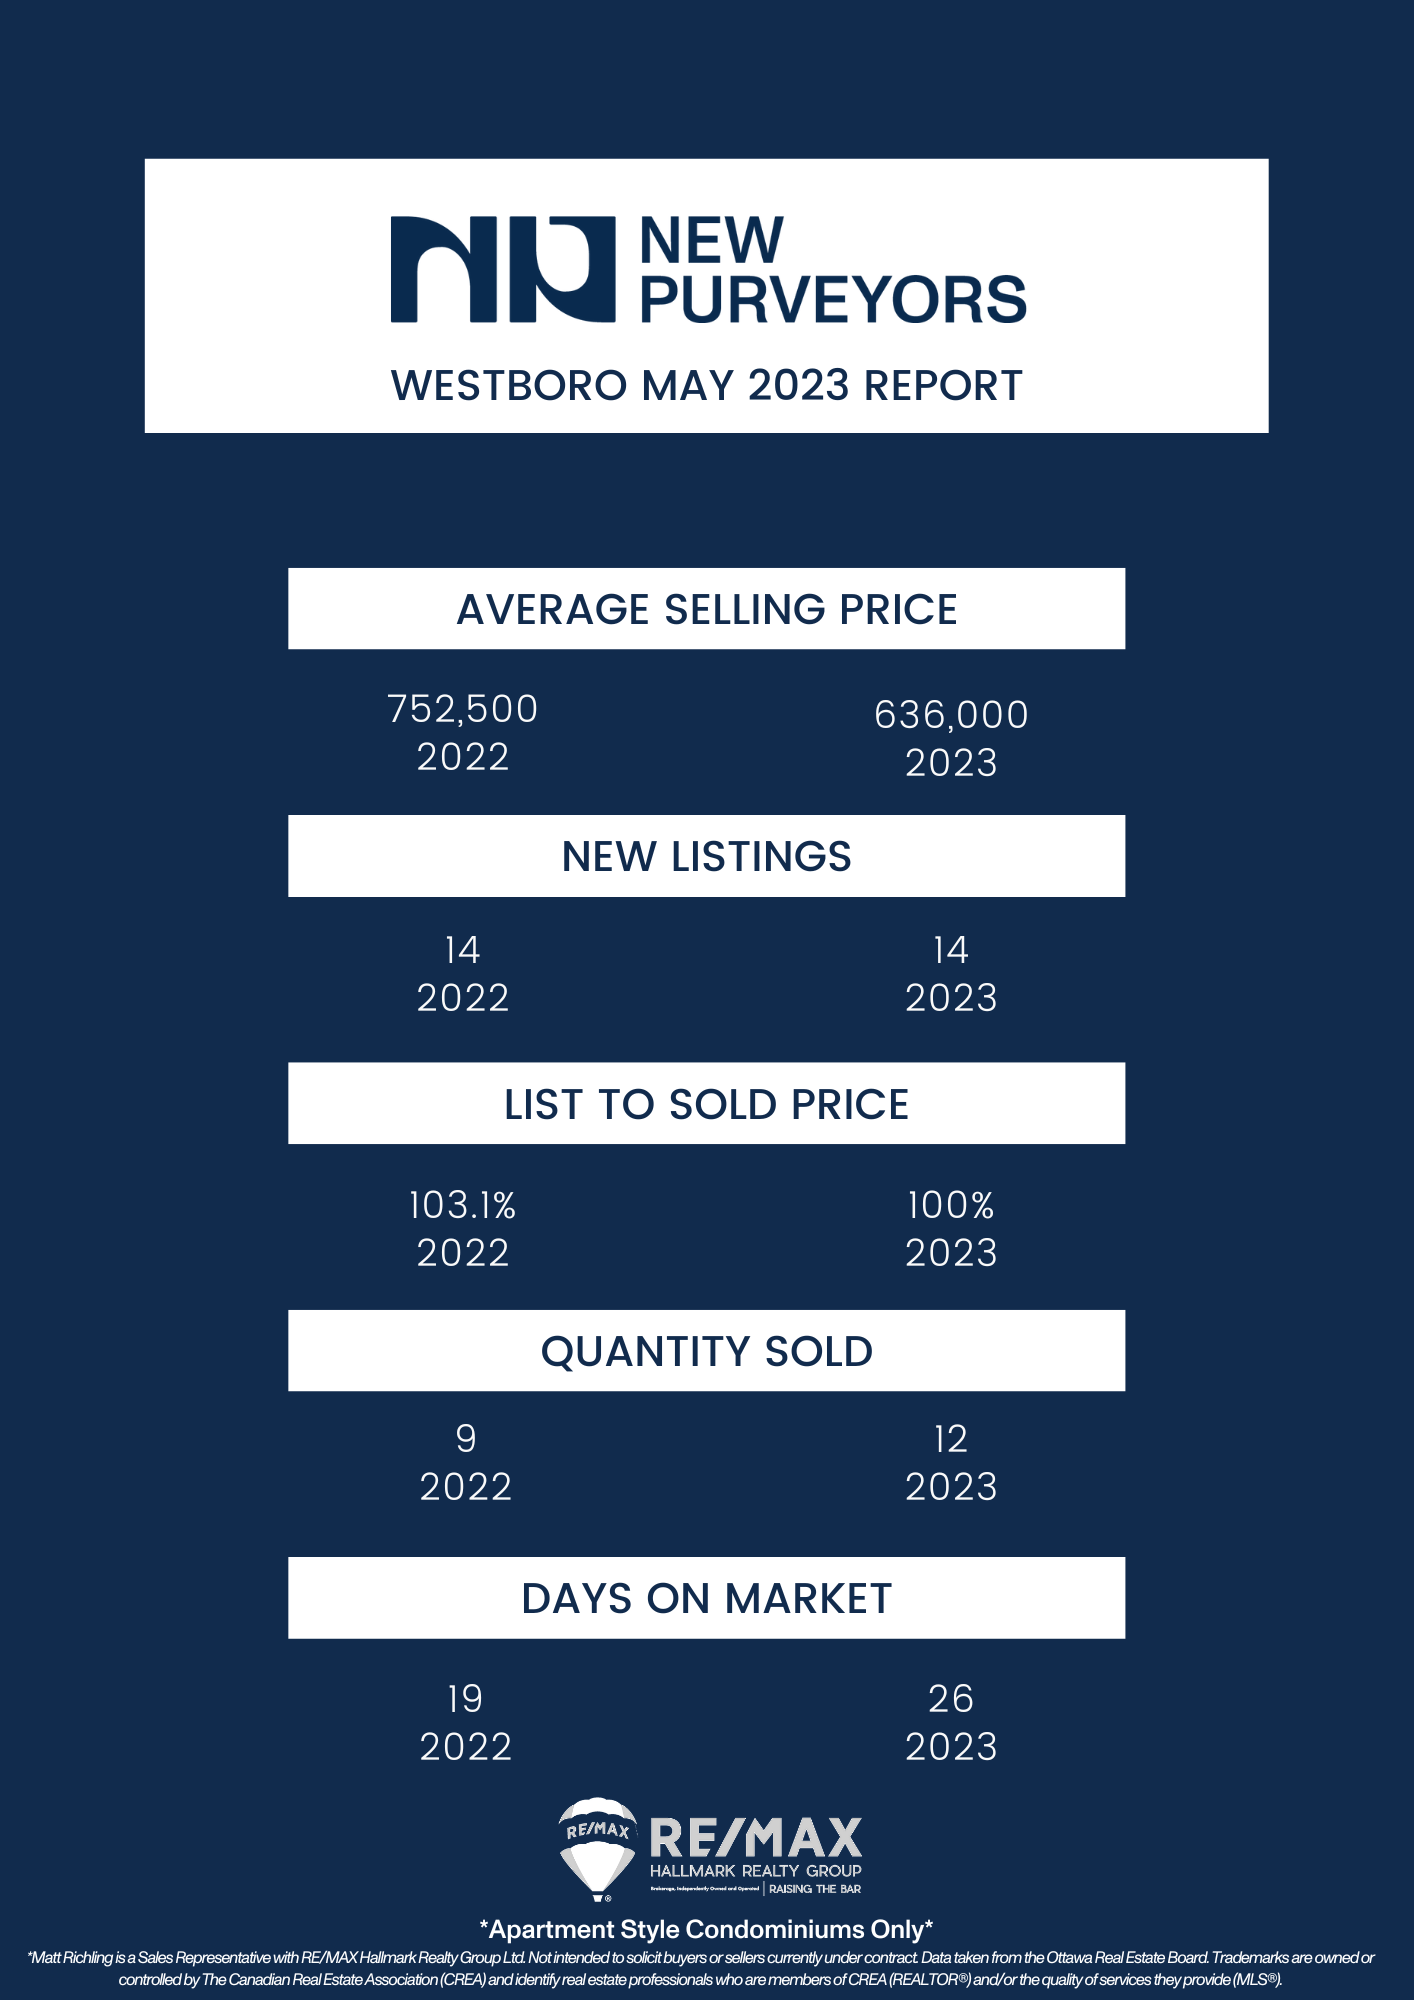
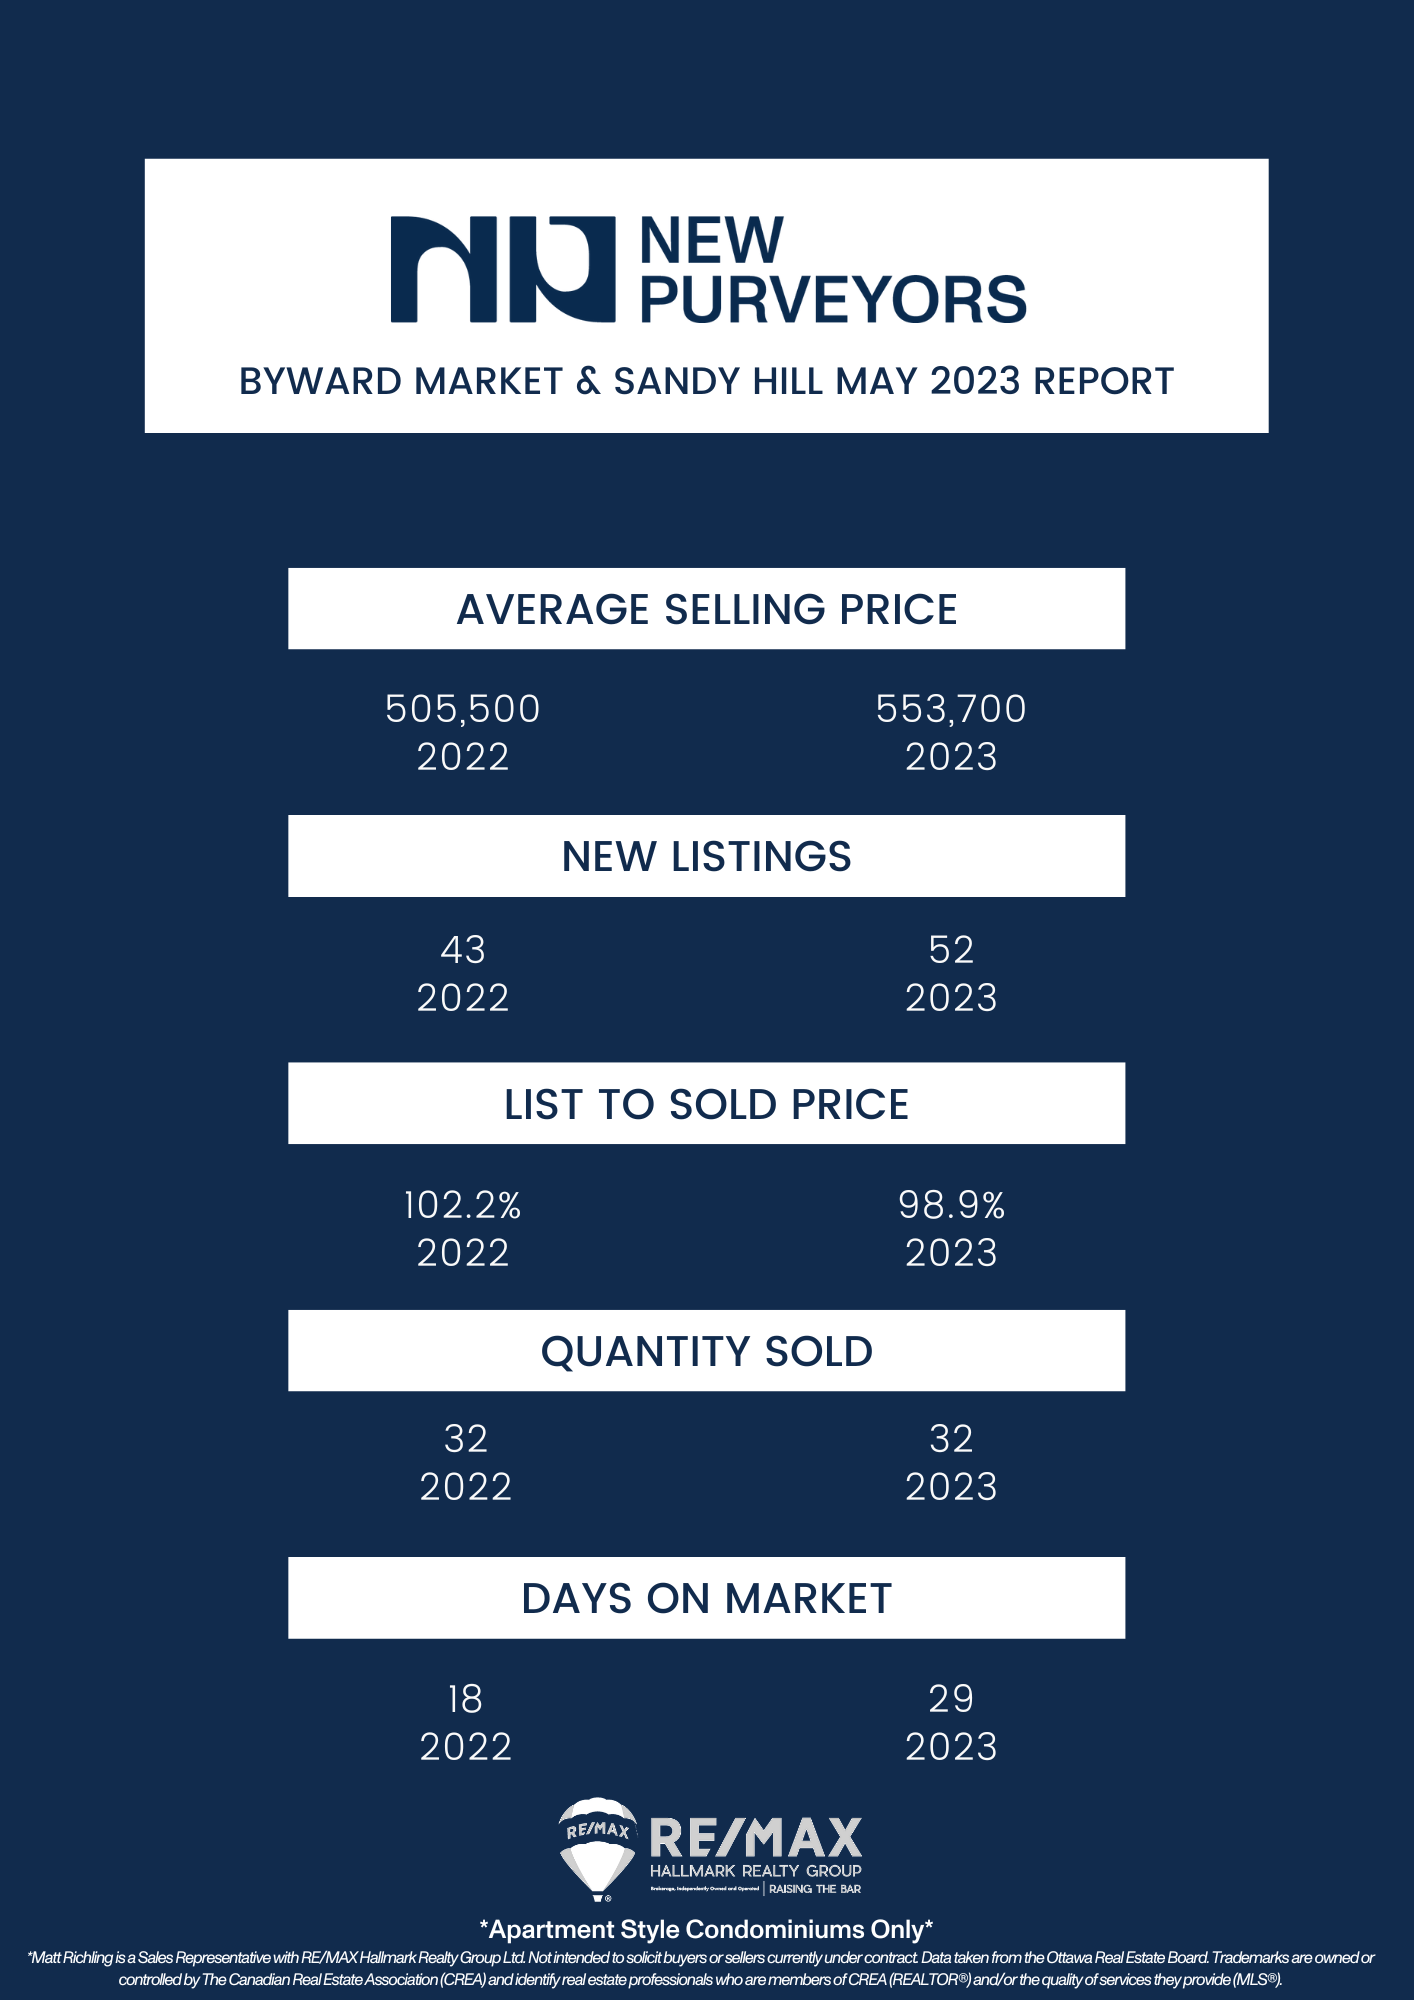
Every month we take a closer look and drill down the sales data of Ottawa condos from the previous month. Here are the statistics for May 2023 in the top five "downtown" areas - Centretown, Byward Market and Sandy Hill, Little Italy (which includes Lebreton Flats), Hintonburg, and Westboro. The information will be specific to apartment-style condominiums, and only what sold through the MLS. Also important to note that DOM (Day's On Market) is calculated to include the conditional period, which in Ottawa is roughly 14 days for almost every single transaction.
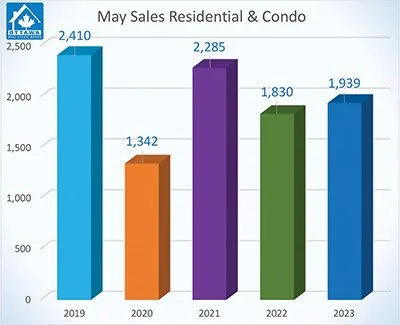
Members of the Ottawa Real Estate Board sold 1939 properties in May, an increase of 6% from May of 2022! This includes 1477 freehold properties (up 8%) and 462 condos (up 1%). This is also just below the five-year average for May, which is 1961.
Ken Dekker, Ottawa Real Estate Board President, explains that May is typically the highest-selling month. He explains that this is the first volume increase in year-over-year sales since February 2022. It shows a lot of promise for sellers who were struggling with finding buyers during the interest rate increases.
Dekker explains that we are only seeing around 5-6 weeks of inventory, so our market is leaning heavily toward the seller side.
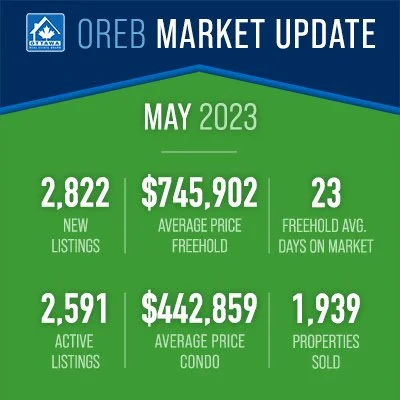
Average prices are decreasing year-over-year, but staying relatively similar to previous months. Freehold properties saw an average price of $745,902, which is a 7% decrease from last year, but the same as last month. Condominium class properties averaged at $442,859, a 6% decrease from last year but a 2% increase from last month. Year to date, freehold properties have seen a 12% decrease in price compared to 2022, and condominiums a 9% decrease from 2022.
Dekker continues to explain that we are not seeing any steep price escalations, and that May’s prices are still on par with April. With higher demand and low inventory, Dekker believes prices will continue to rise as long as interest rates remain the same or begin to drop.
May saw 2822 listings, which is down 9% from May 2022’s 3117 new listings, but up from last month’s 2140 new listings. This is also only slightly lower than the 5-year average for May listings, which is 2922.
Freehold inventory for this month has increased to 1.5 months over 1.2 months in May of 2022 but is down from the 1.9 months available in April. Condominium inventory has increased from 1 month in May 2022 to 1.3 months in May 2023 but is down from 1.9 months last month. Days on market for freeholds has dropped from 27 to 23 days. And for condos, from 33 to 26 over the last month.
Dekker explains that due to low inventory, multiple offer scenarios are happening more often, and that a well-equipped real estate agent will be able to help buyers and sellers navigate this new market.
Finally, OREB members helped 2731 clients find rentals in May, up 22% from the 2230 people assisted in May of 2022.
Important to note is that these statistics can only be as accurate as there are condos sold in Ottawa. The more condos sold in an area, the more accurate the averages will be.
Want to chat about your options? Fill out the form at the bottom of the page, or text/call us directly 613-900-5700 or fill out the form at the bottom of the page.
Do you have any questions about how this information affects your investment or looking for more information to make the best decision about your purchase? Let’s chat! Fill out the form on the bottom of the page.