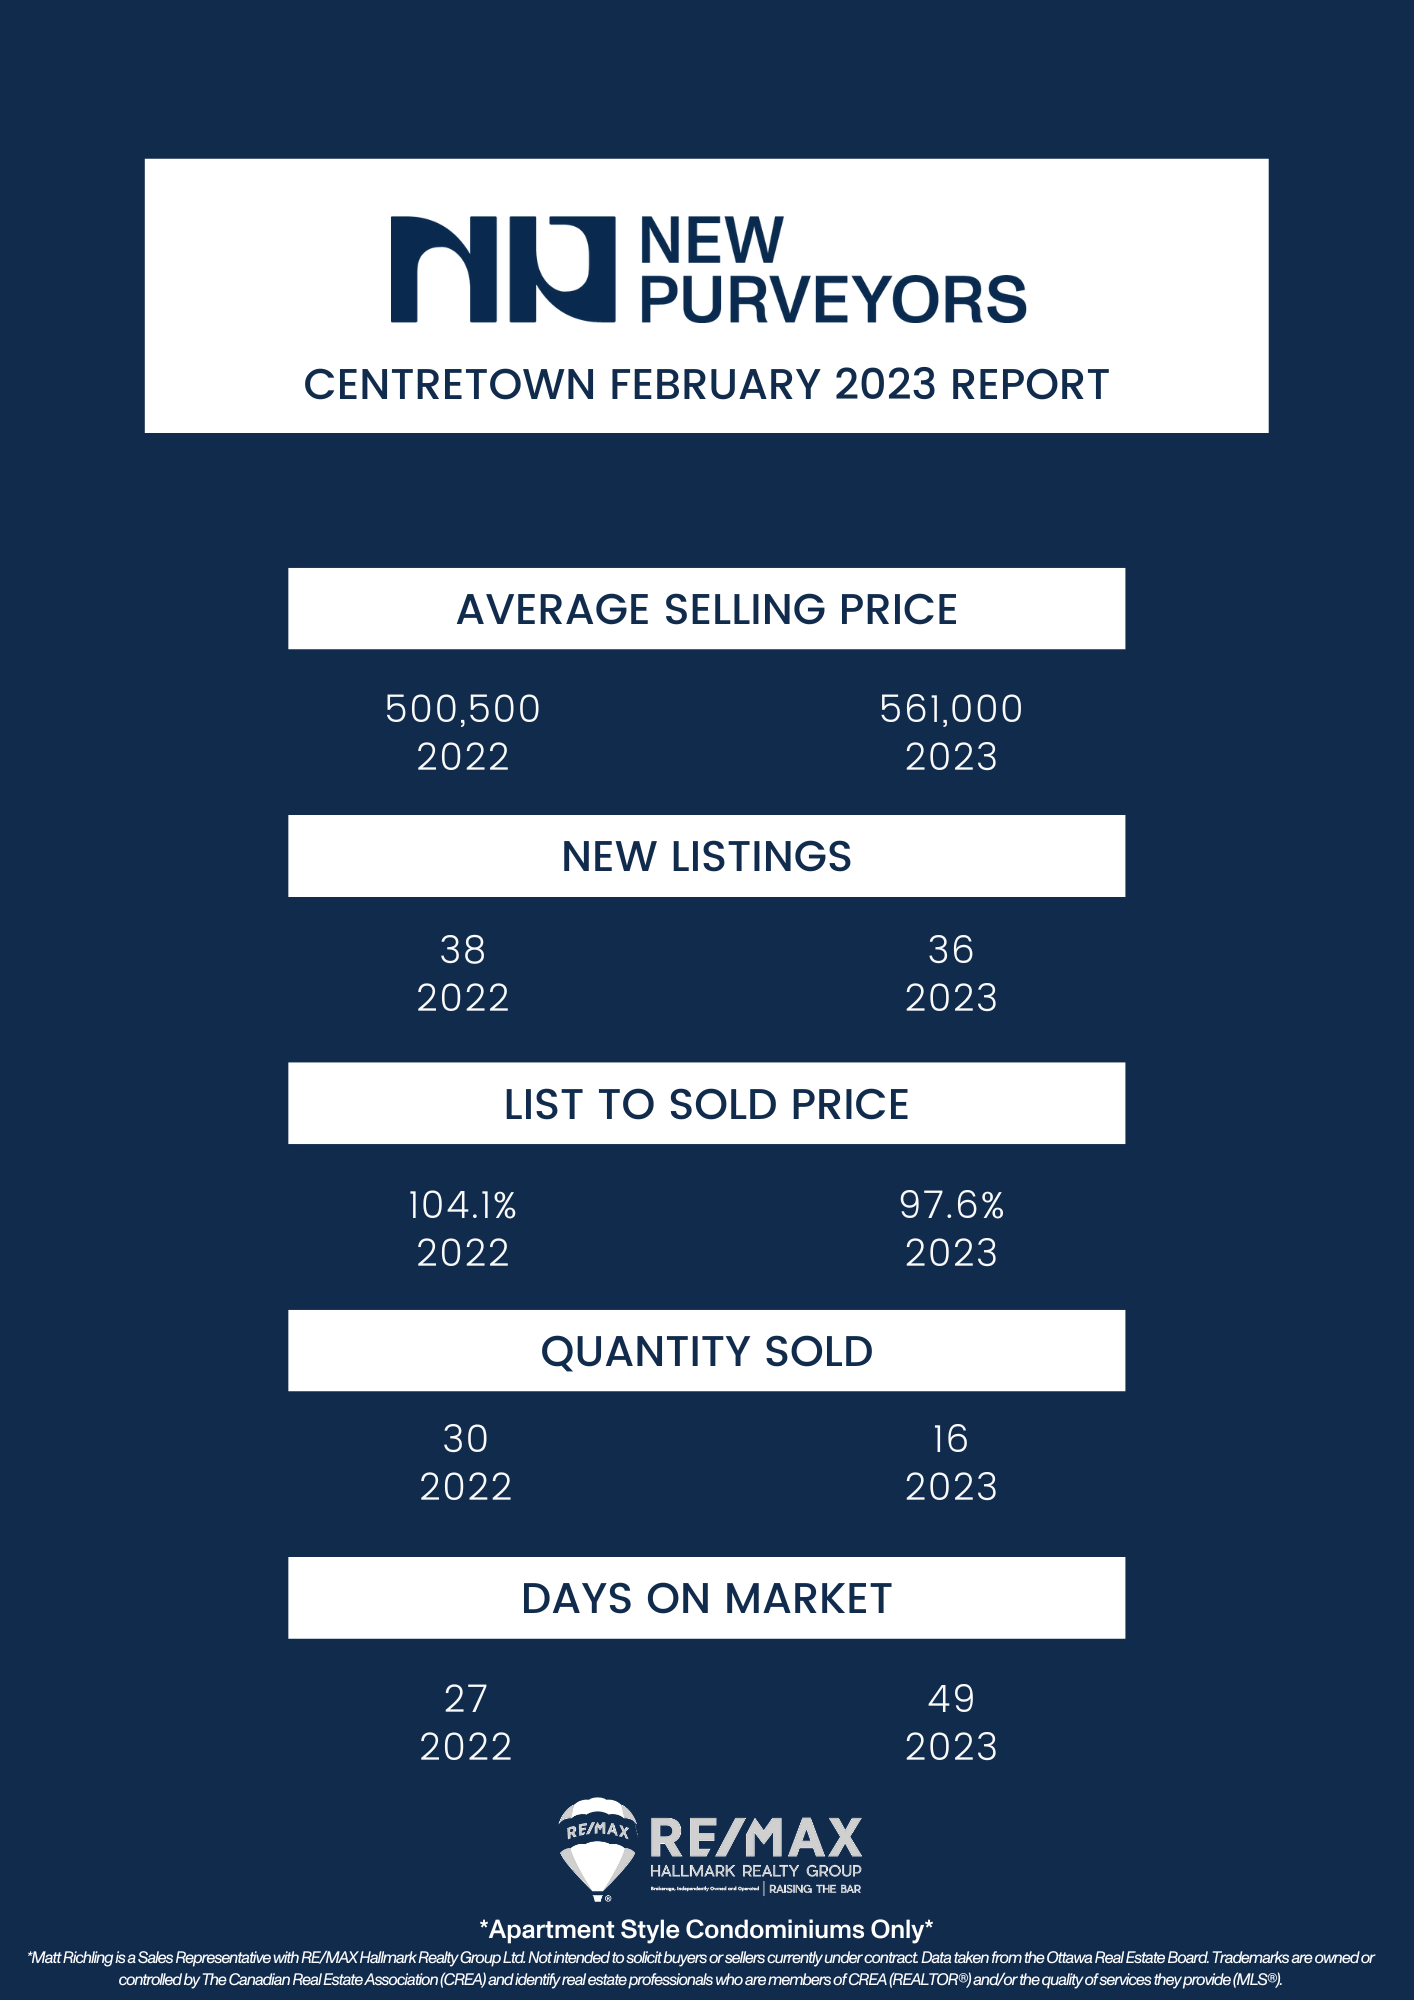
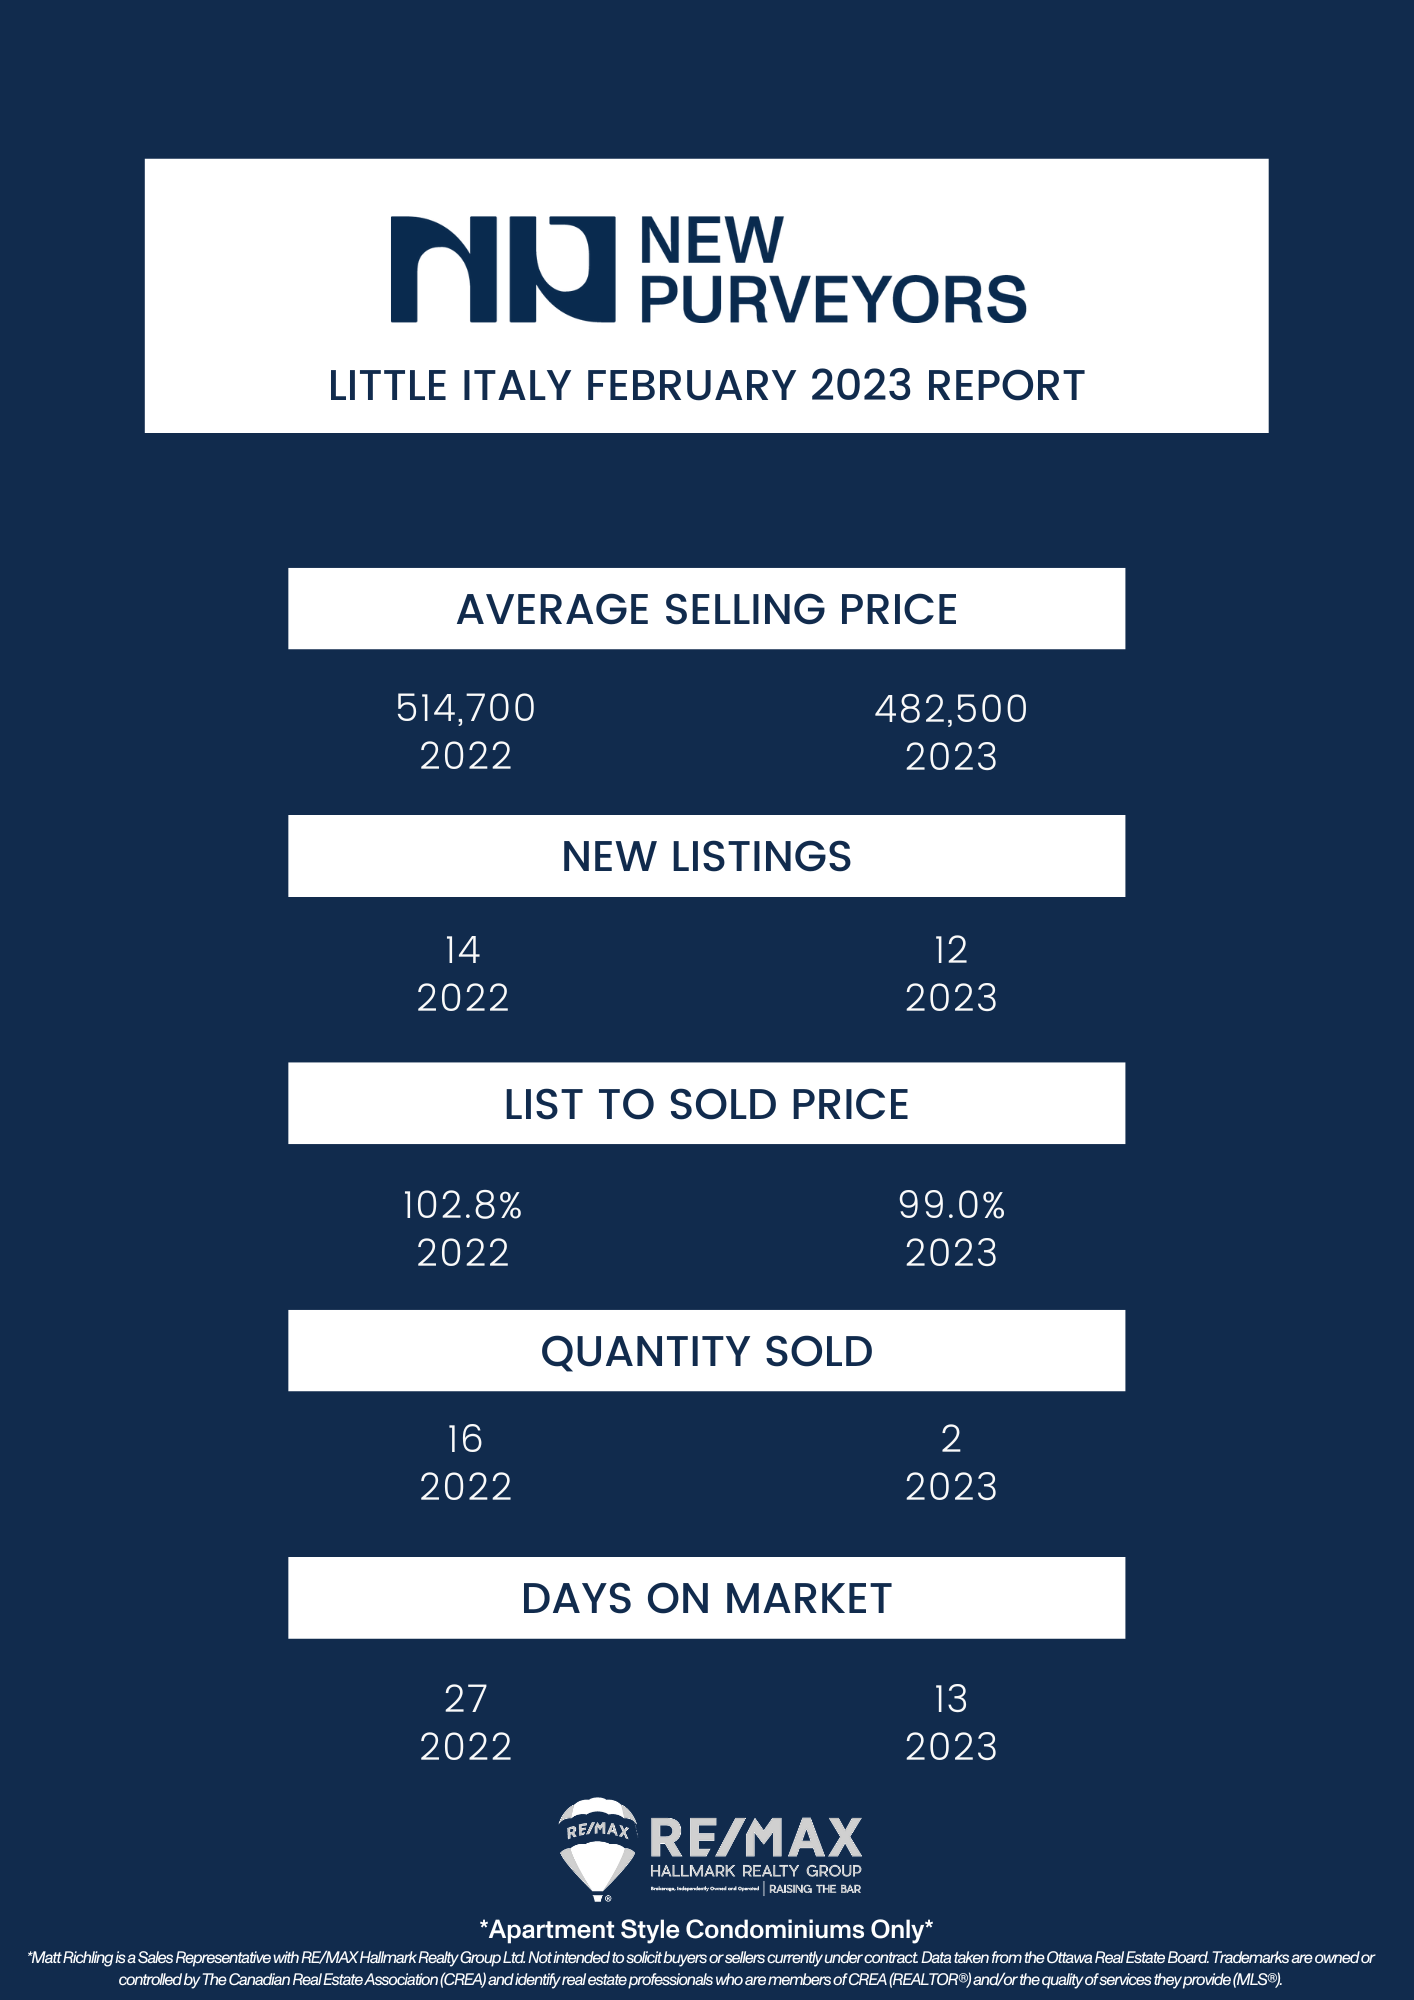
Every month we take a closer look and drill down the sales data of Ottawa condos from the previous month. Here are the statistics for February 2023 in the top five "downtown" areas - Centretown, Byward Market and Sandy Hill, Little Italy (which includes Lebreton Flats), Hintonburg, and Westboro. The information will be specific to apartment-style condominiums, and only what sold through the MLS. Also important to note that DOM (Day's On Market) is calculated to include the conditional period, which in Ottawa is roughly 14 days for almost every single transaction.
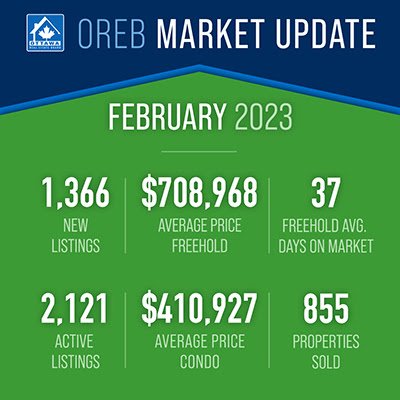
In the month of February, Ottawa Real Estate Board members sold 855 residential properties through MLS. This is down 39% from last year’s 1411 sales. This includes 633 freehold-class properties (down 42% year over year), and 222 condominium-class properties (down 31%). This is also down from the five year average for total sales in the month of February, which is 1157.

Average sale prices are still down year over year. Freehold properties are seeing an average price of $708,968 which is a decrease of 15% from February 2022. However, this is an increase of 5% compared to January 2023, which is a promising trend.
Condominium prices averaged $410,927, which is a decrease of 12% from February last year.
Year-to-date averages also show a decrease - of 14% for freeholds and 10% for condominiums.
Ken Dekker, OREB President, explains that “the average price increase” indicates that buyers have gotten used to the current interest rates, which is a sign of hope for the future!
Inventory in the city has increased. Year over year, we’ve seen huge increases in properties on the market in both freehold and condominium-class properties.
Freehold properties increased from 0.7 months of inventory to 2.8 months. Condominium inventory increased from 0.7 months to 2.5 months.
February’s new listings for 2023 were 22% lower than February 2022, but were up 3% from January 2023. Compared to the 5 year average of 1632 new listings, this February we saw 1366.
Days on market decreased from 43 to 37 days for freeholds and 47 to 43 for condominiums compared to last month as well.
A decrease in days on market, says Dekker, paired with fewer new listings coming on the market, is great news for sellers. It’s unclear now if those trends will take us back to a seller’s market from the balanced market we are currently in, but we’ll begin to see in the next few months.
Since the beginning of the year, OREB Members have assisted clients with renting 995 properties compared to 800 last year at this time, an increase of 24%.
Important to note is that these statistics can only be as accurate as there are condos sold in Ottawa. The more condos sold in an area, the more accurate the averages will be.
Want to chat about your options? Fill out the form at the bottom of the page, or text/call us directly 613-900-5700 or fill out the form at the bottom of the page.
Do you have any questions about how this information affects your investment or looking for more information to make the best decision about your purchase? Let’s chat! Fill out the form on the bottom of the page.