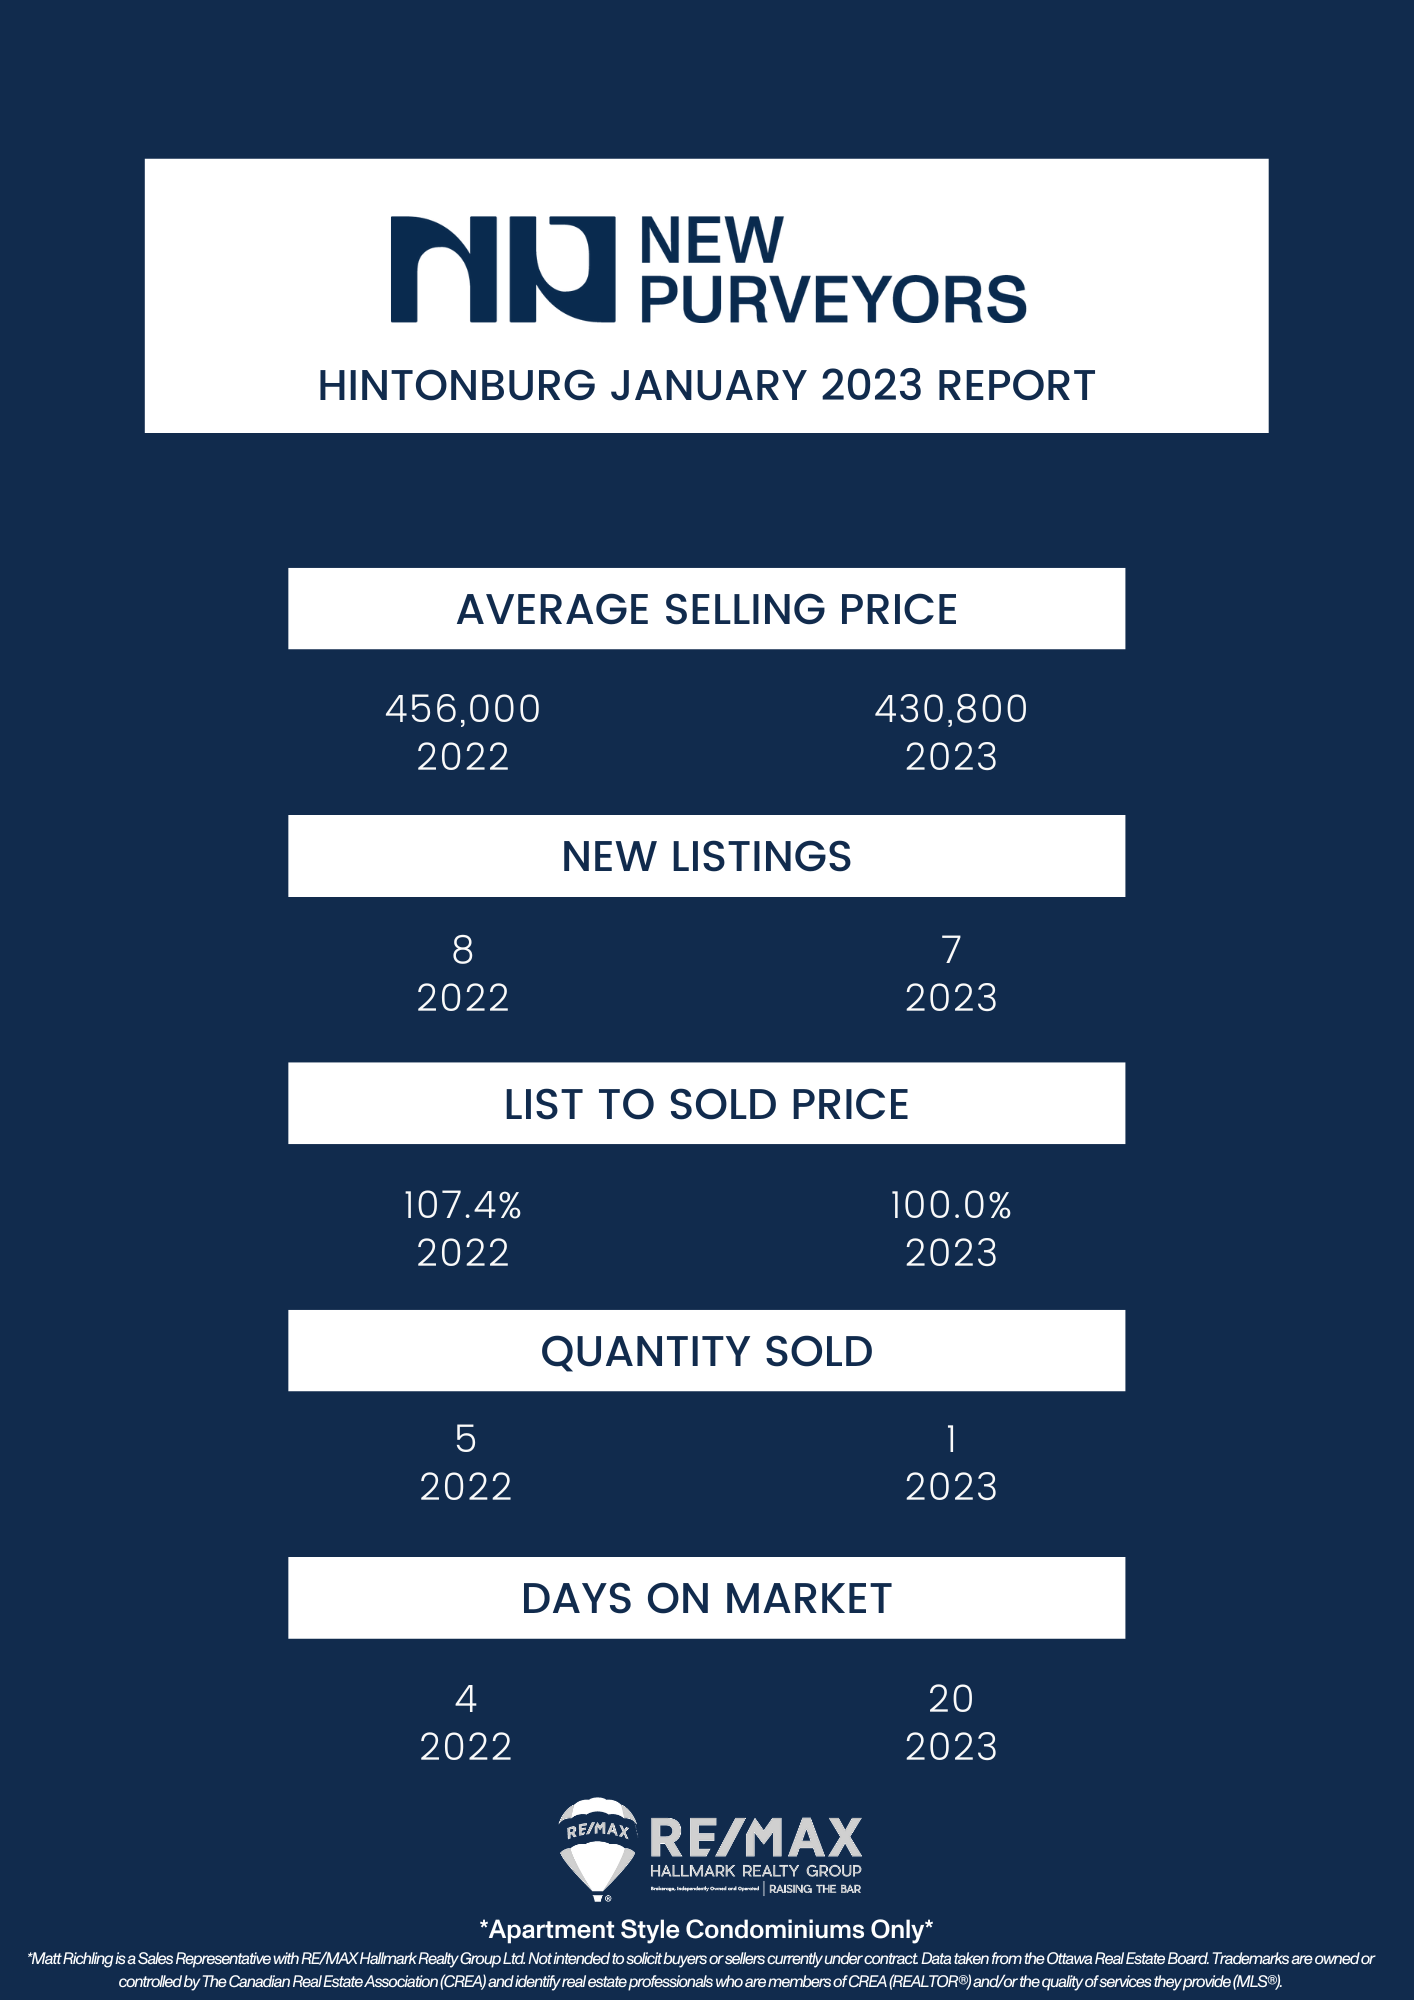
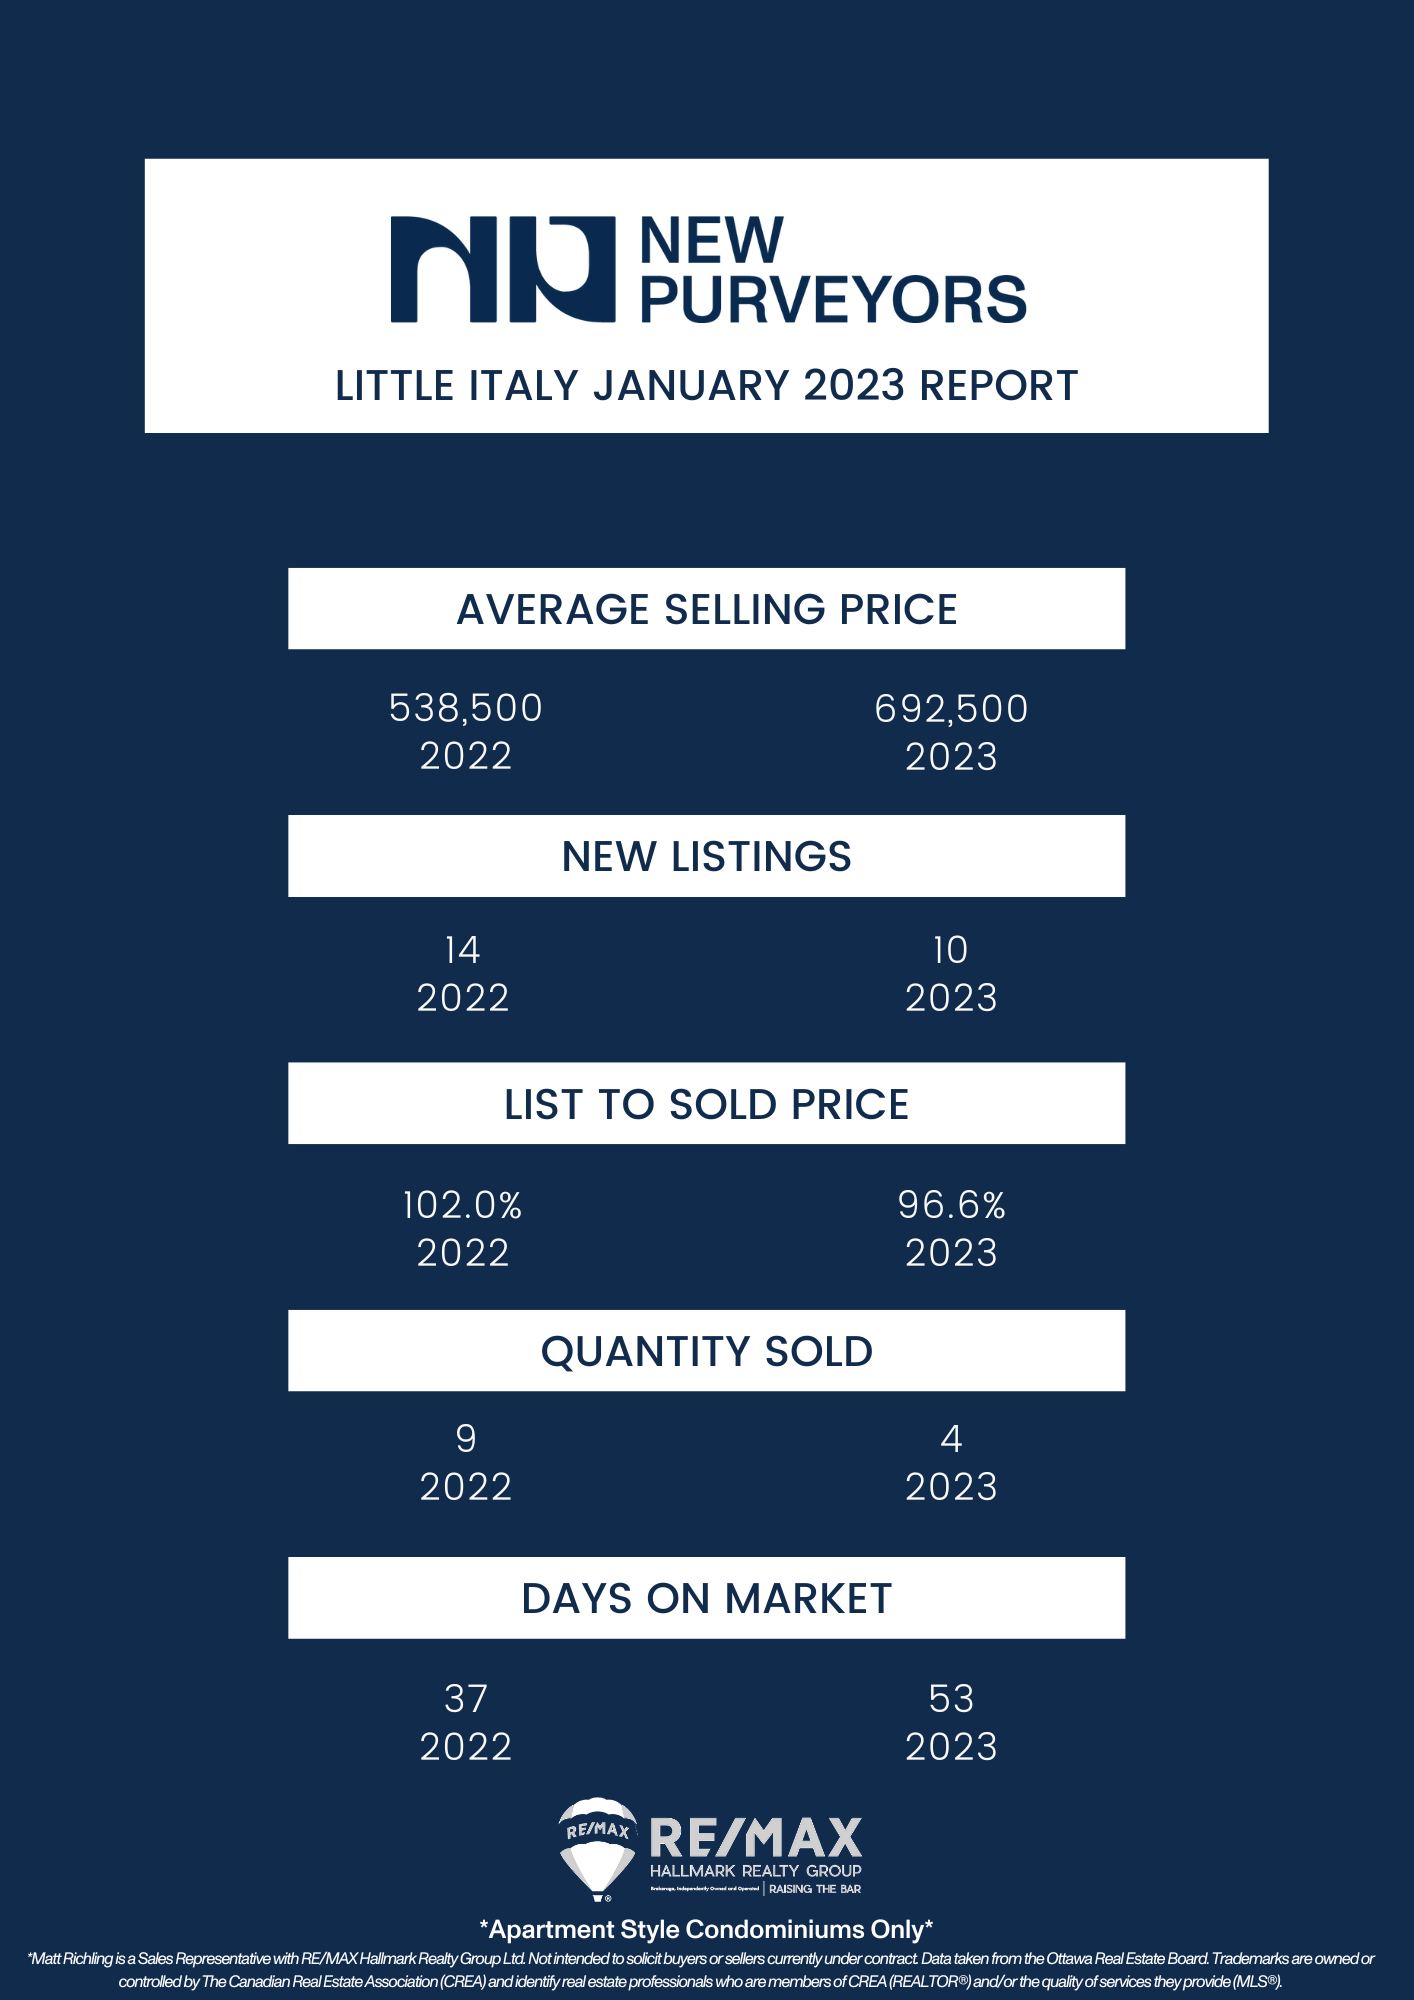
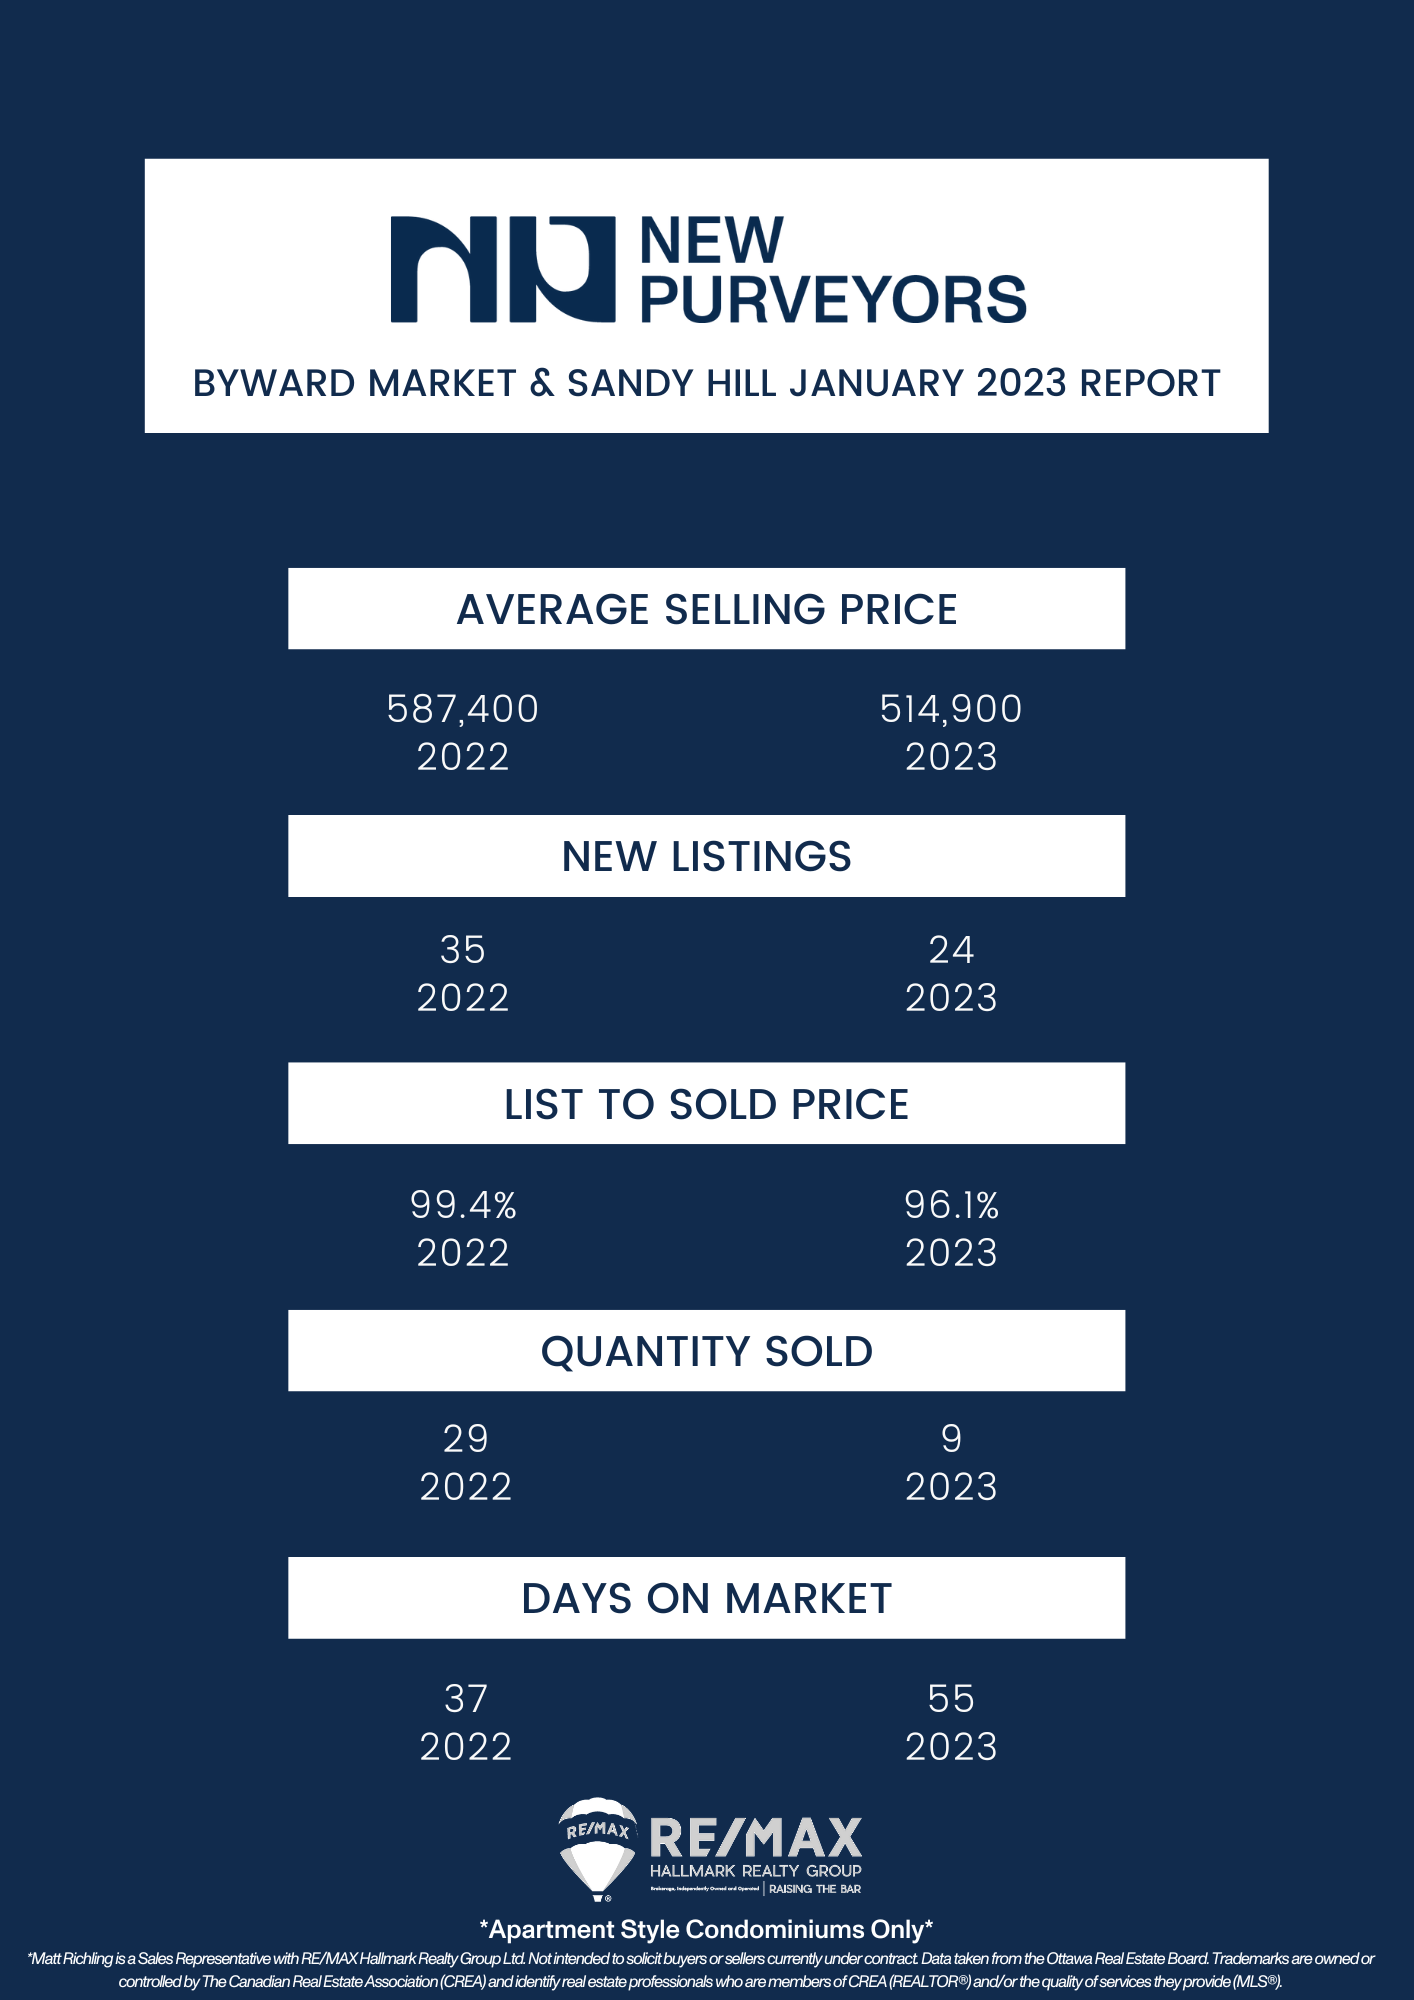
Every month we take a closer look and drill down the sales data of Ottawa condos from the previous month. Here are the statistics for January 2022 in the top five "downtown" areas - Centretown, Byward Market and Sandy Hill, Little Italy (which includes Lebreton Flats), Hintonburg, and Westboro. The information will be specific to apartment-style condominiums, and only what sold through the MLS. Also important to note that DOM (Day's On Market) is calculated to include the conditional period, which in Ottawa is roughly 14 days for almost every single transaction.
In the month of January, OREB members sold 606 residential properties. This is down 35% from last January, when we sold 933. This includes 460 residential class properties and 146 condominiums, down 30% and 47% respectively. This is also significantly lower than the 5-year average of 819 sales.

The new OREB President, Ken Dekker, explains that the slowdown indicates potential home buyers are taking their time. He states he believes they are being cautious during uncertain conditions.
In terms of prices: Condo properties saw a decrease of 8% for an average of $412,244. Freehold properties saw a decrease of 12% from last January, with an average price of $676,272. However, Dekker explains this isn’t a crashing market, but instead a market that is just balancing out after the extreme prices and low rates during COVID. It is ‘levelling out’.
It’s also a good sign that prices are actually increasing from December! Up 3% month over month. Condo prices have dropped in comparison, around 5%, but those numbers are actually more volatile due to fewer condos being sold than freehold properties.
Inventory has also increased! Freehold properties are now up to 3.8 months rather than 0.9 months last January. Condos are also up to 3.8 months of inventory instead of 0.8 last January. New listings this month are sitting at 1324, 16% higher than 1142 in January 2022, and are up 899 from December 2022 when there were only 699 listings. This is also higher than the 5-year average for January, which was 1233.
Dekker explains that these figures are typical for a balanced market, a sign that buyers aren’t “racing to put in an offer.” New listings and supply illustrate to buyers that they can take time selecting a home and put in the conditions that they want in their offers.
More people are also turning to real estate agents for help with rentals, up 24% from 410 last year to 509 this year.

Important to note is that these statistics can only be as accurate as there are condos sold in Ottawa. The more condos sold in an area, the more accurate the averages will be.
Want to chat about your options? Fill out the form at the bottom of the page, or text/call us directly 613-900-5700 or fill out the form at the bottom of the page.
Do you have any questions about how this information affects your investment or looking for more information to make the best decision about your purchase? Let’s chat! Fill out the form on the bottom of the page.