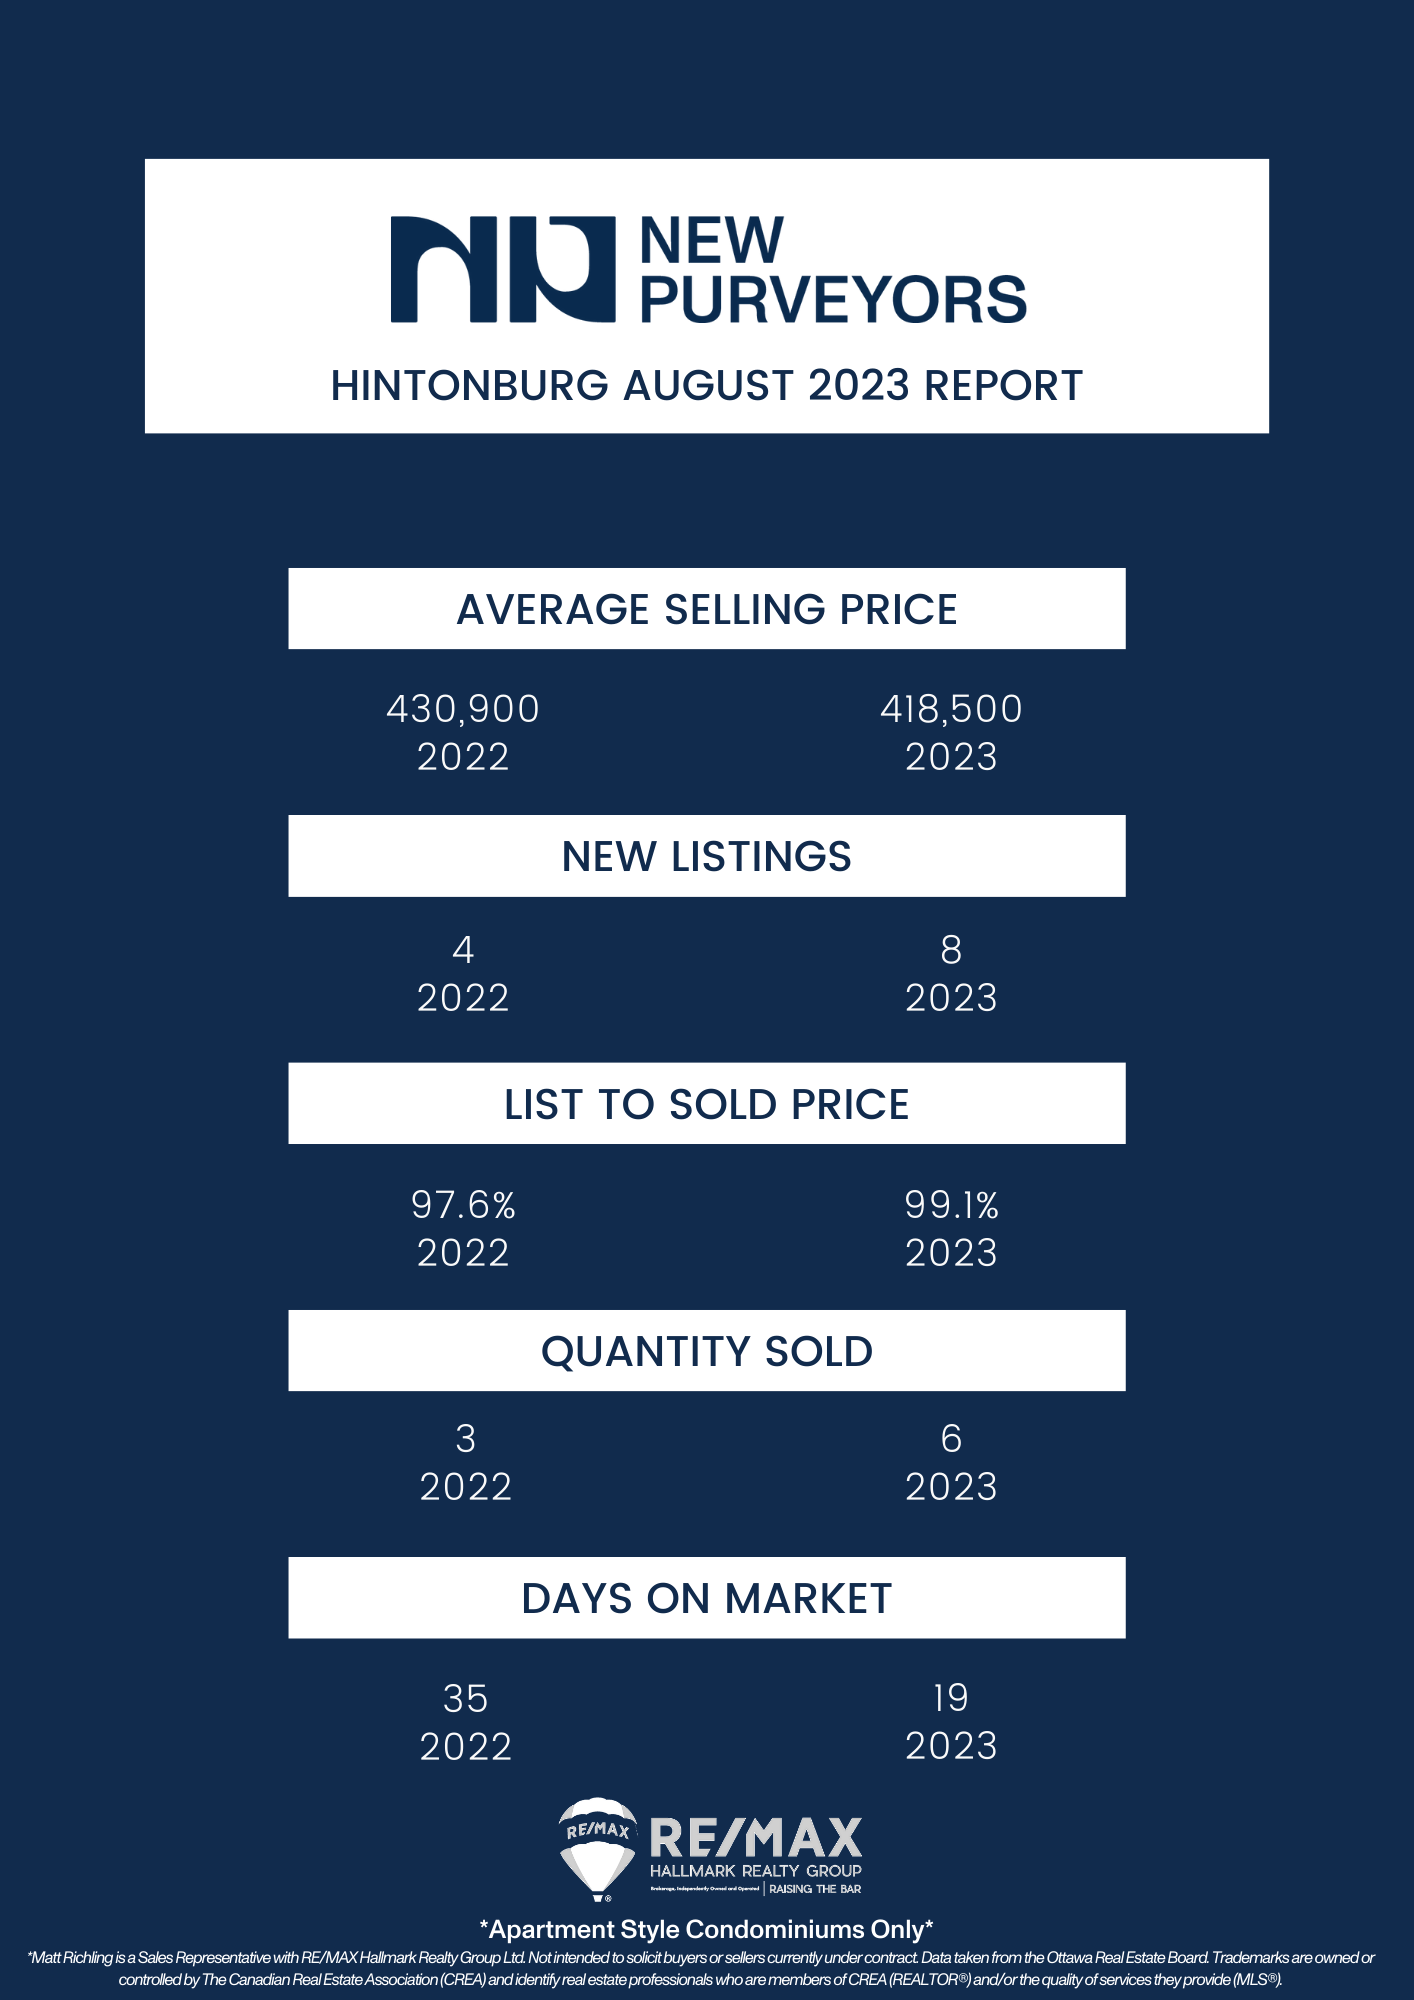
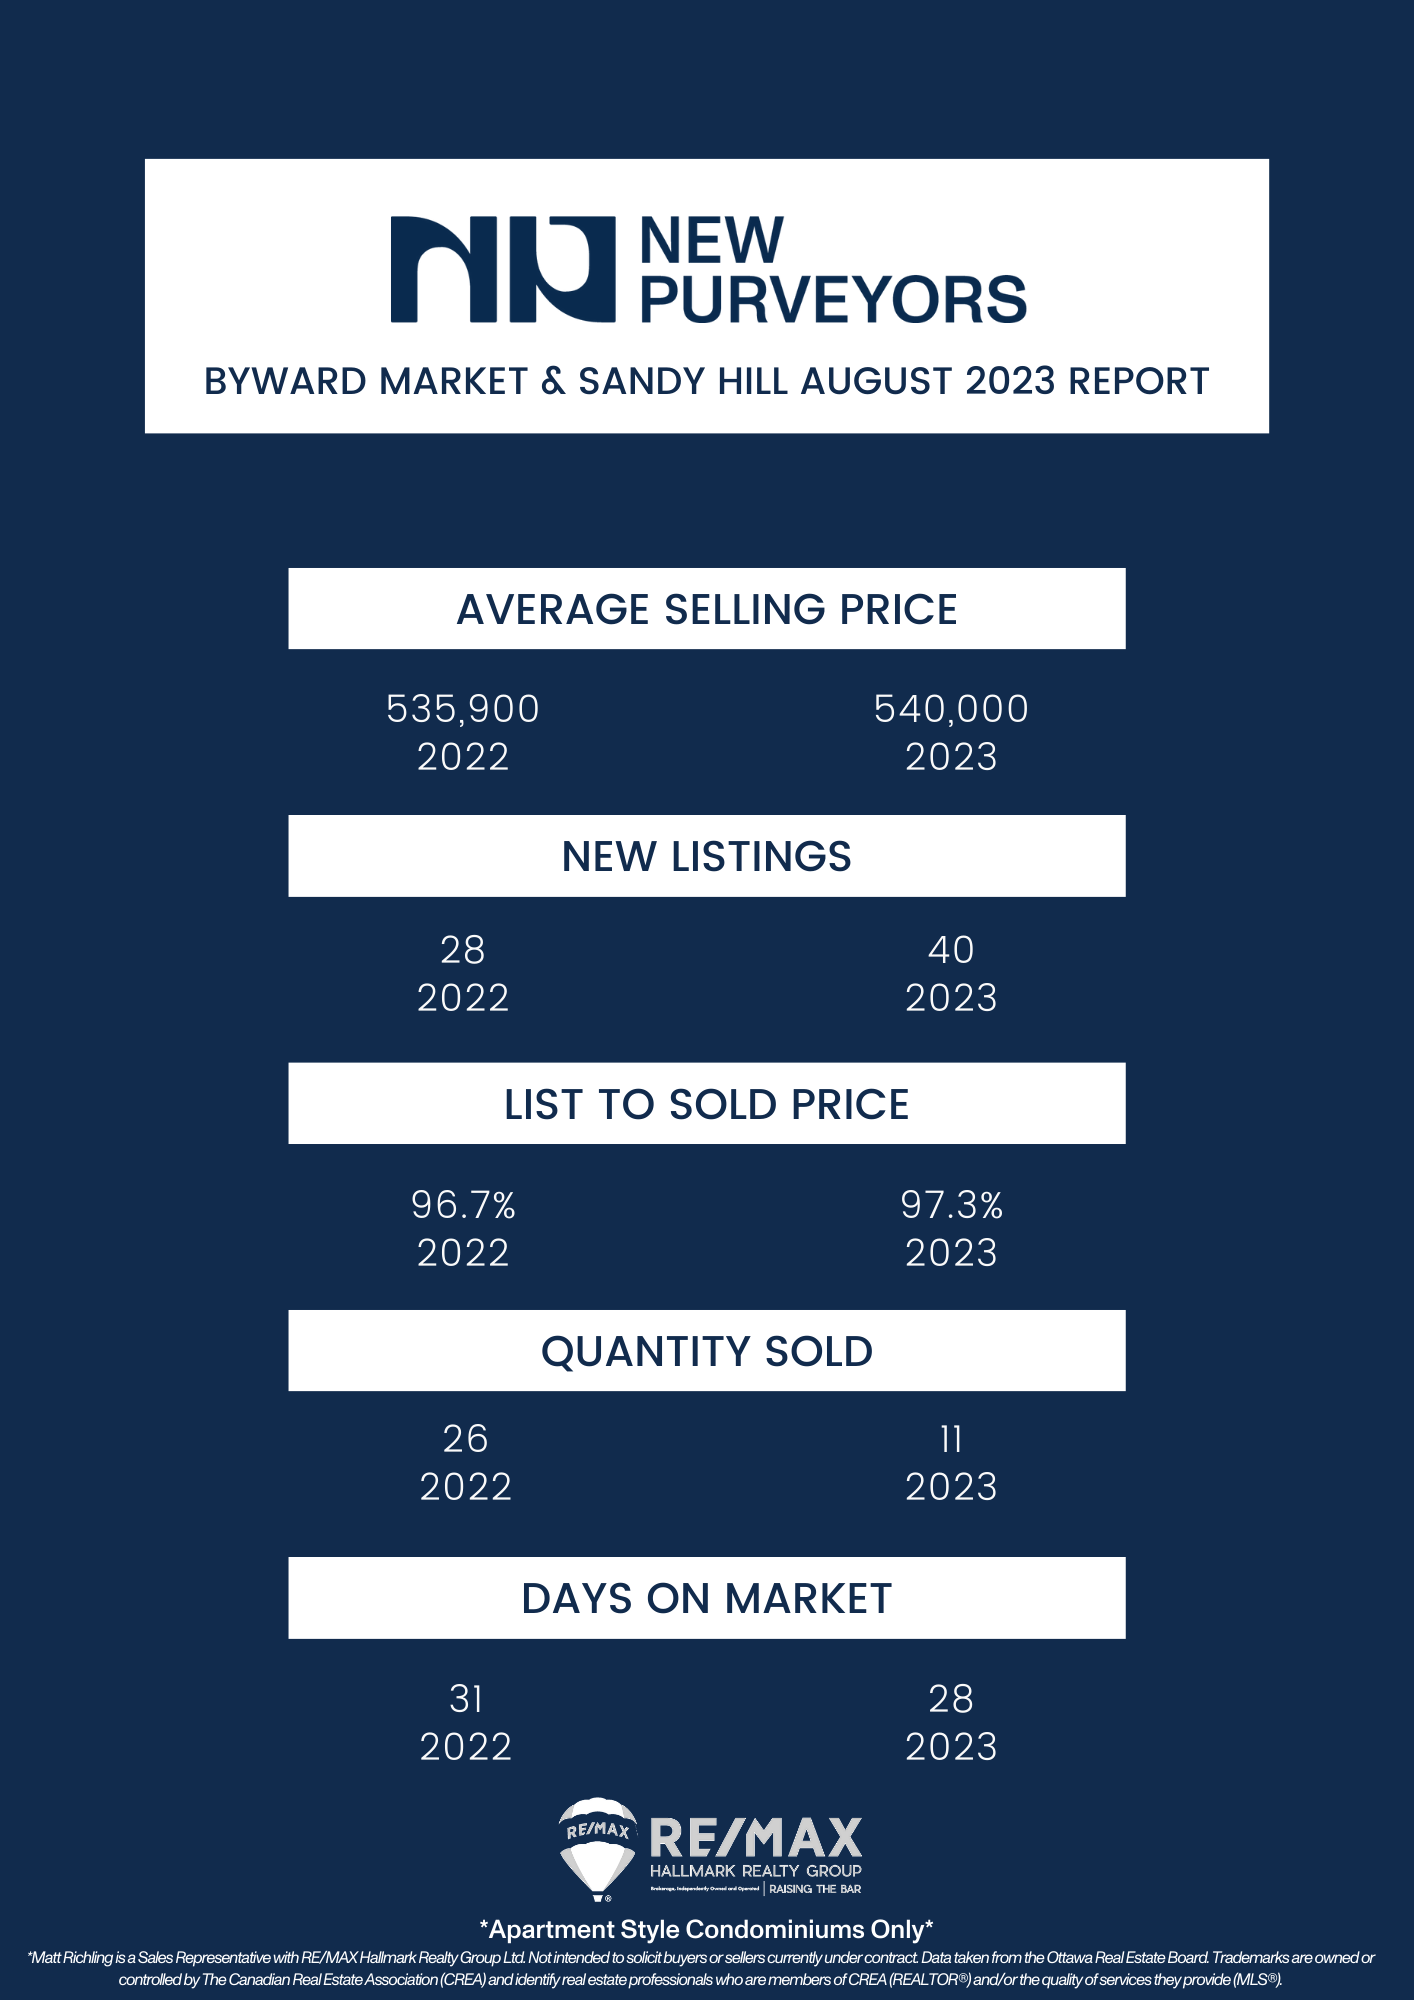
Every month we take a closer look and drill down the sales data of Ottawa condos from the previous month. Here are the statistics for August 2023 in the top five "downtown" areas - Centretown, Byward Market and Sandy Hill, Little Italy (which includes Lebreton Flats), Hintonburg, and Westboro. The information will be specific to apartment-style condominiums, and only what sold through the MLS. Also important to note that DOM (Day's On Market) is calculated to include the conditional period, which in Ottawa is roughly 14 days for almost every single transaction.
In the month of August, OREB members sold 1196 residential properties - up 6% over last year. This is broken down into 903 freeholds (up 7% from the same period last year) and 293 condos (up 2% from the same period last year). However, these numbers are lower than the five-year average for August.
OREB President Ken Dekker explains that sales in August hve increased year over year but still remain below historical averages. This can be attributed to strong demand entering the market through our growing population, contrasted by the lack of suitable or affordable housing options and high borrowing costs.

Key figures include:
Average Prices:
The average sale price for freehold-class properties in August was $709,739, a 0.5% increase from 2022 but a 5.6% decrease compared to July 2023.
Condominium-class properties had an average sale price of $425,968, a 1% increase from the previous year but 1.4% lower than July 2023.
Year-to-date average sale prices are $732,220 for freeholds (an 8% decrease from 2022) and $432,571 for condos (a 5.5% decrease from 2022).
Inventory & New Listings:
August's new listings totalled 2,228, a 7% increase from August 2022, and were on par with the previous month (2,234). The 5-year average for new listings in August is 2,177.
Months of Inventory for freehold-class properties increased to 3 months from 2.9 months in August 2022 and 2.7 months in July 2023.
Months of Inventory for condominium-class properties remained similar to August 2022 at 2.2 months, slightly decreasing from 2.3 months in July 2023.
Days on market (DOM) for freeholds increased to 31 days from 25 days in August 2022 and 26 days in July 2023.
DOM for condos increased to 29 days from 28 days in August 2022 and 28 days in July 2023.
Additionally, OREB Members have played a crucial role in assisting clients with rentals, facilitating the renting of 4,571 properties since the beginning of the year, marking a 10% increase compared to the same period last year when 4,172 properties were rented.

Important to note is that these statistics can only be as accurate as there are condos sold in Ottawa. The more condos sold in an area, the more accurate the averages will be.
Want to chat about your options? Fill out the form at the bottom of the page, or text/call us directly 613-900-5700 or fill out the form at the bottom of the page.
Do you have any questions about how this information affects your investment or looking for more information to make the best decision about your purchase? Let’s chat! Fill out the form on the bottom of the page.