Westboro

Q West - New Ashcroft Building Coming Soon

Monocle qwest abbey building rendering condo.png

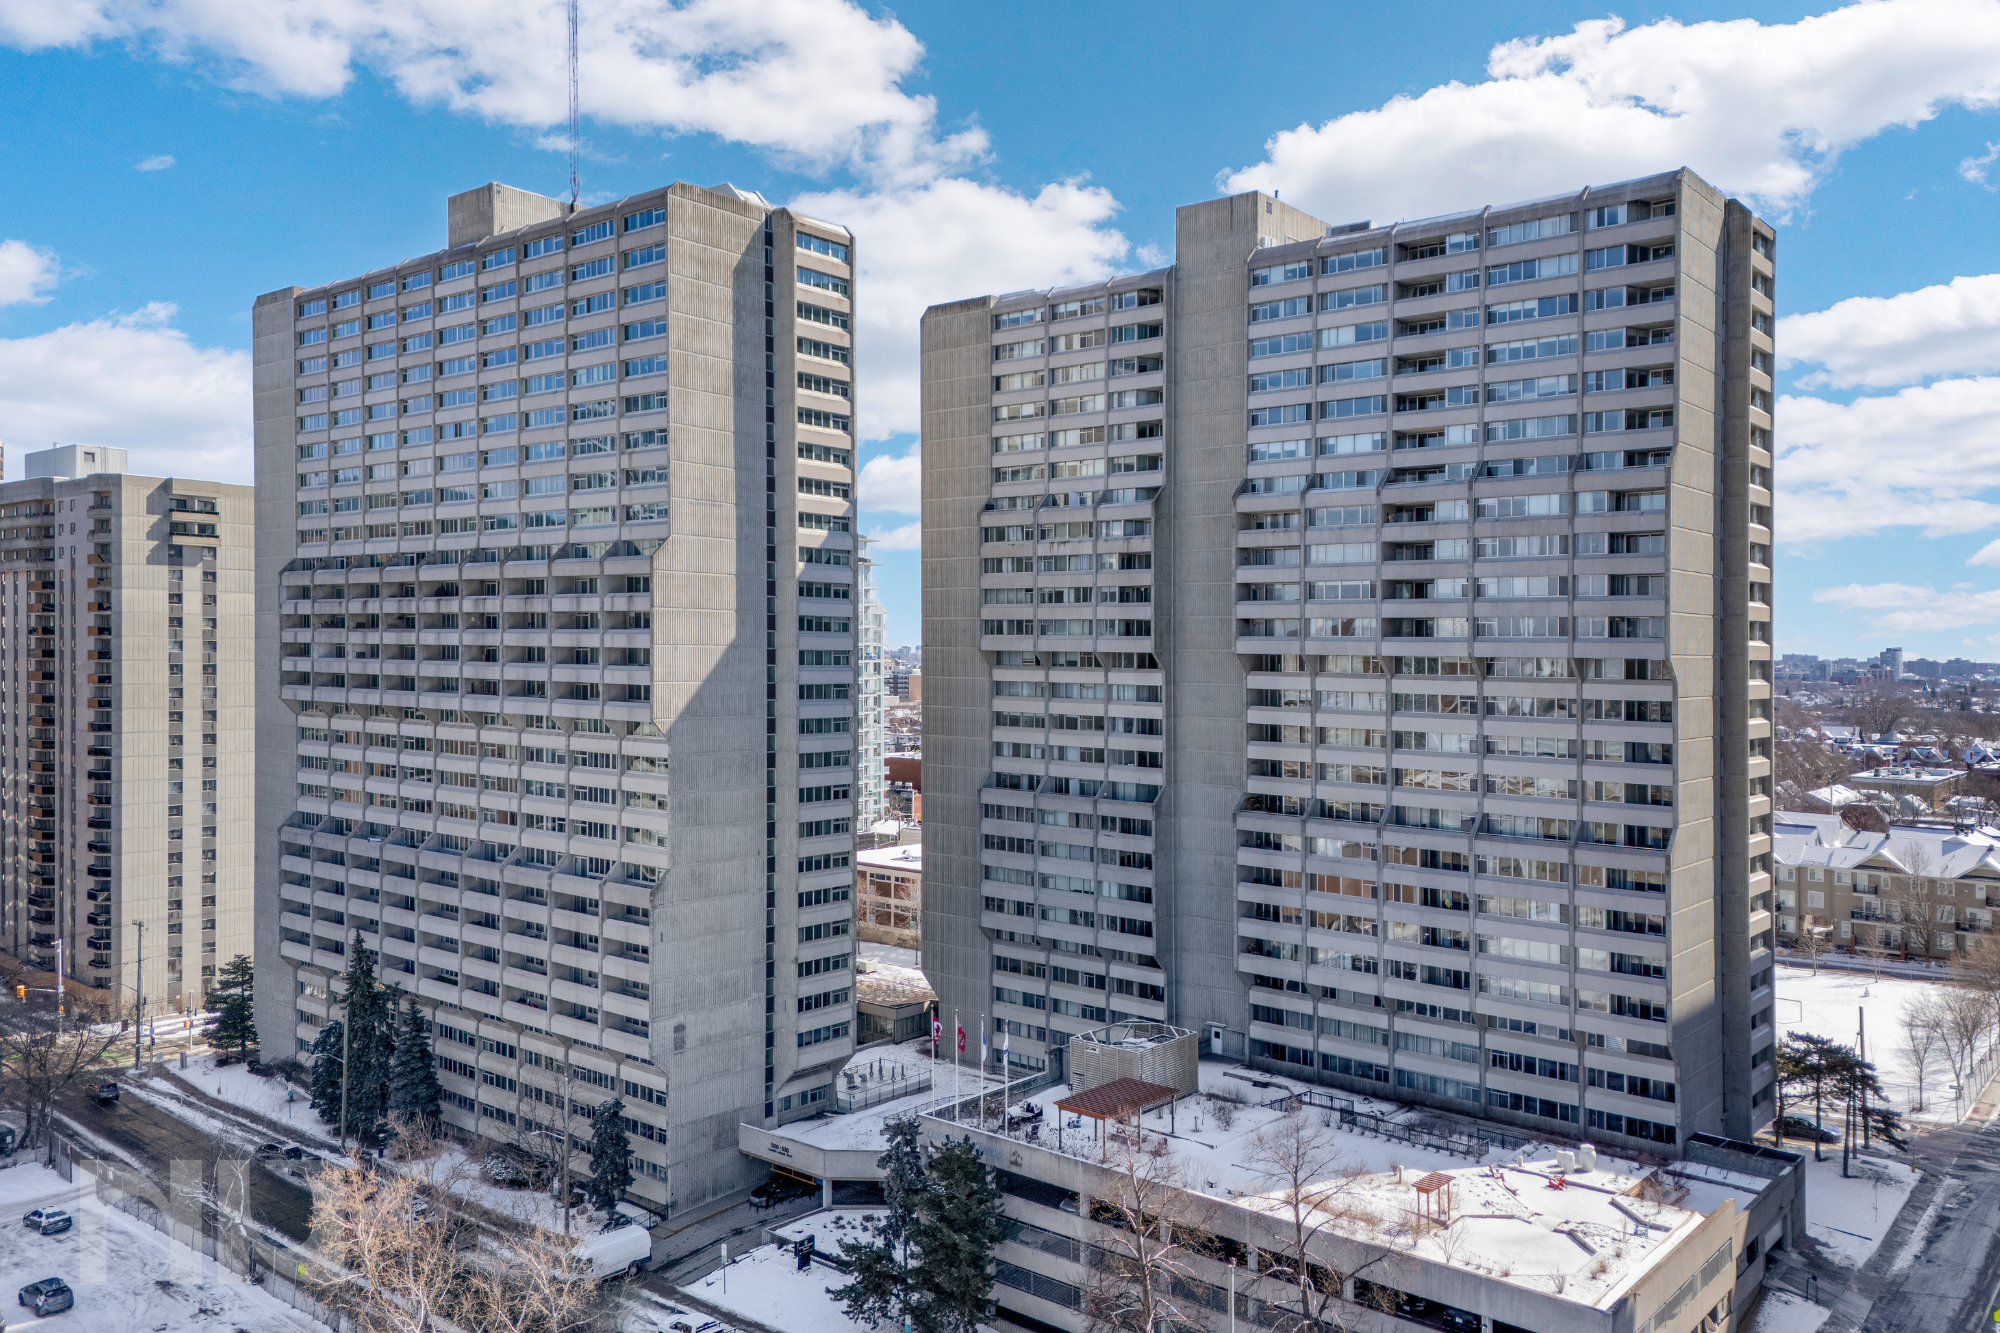
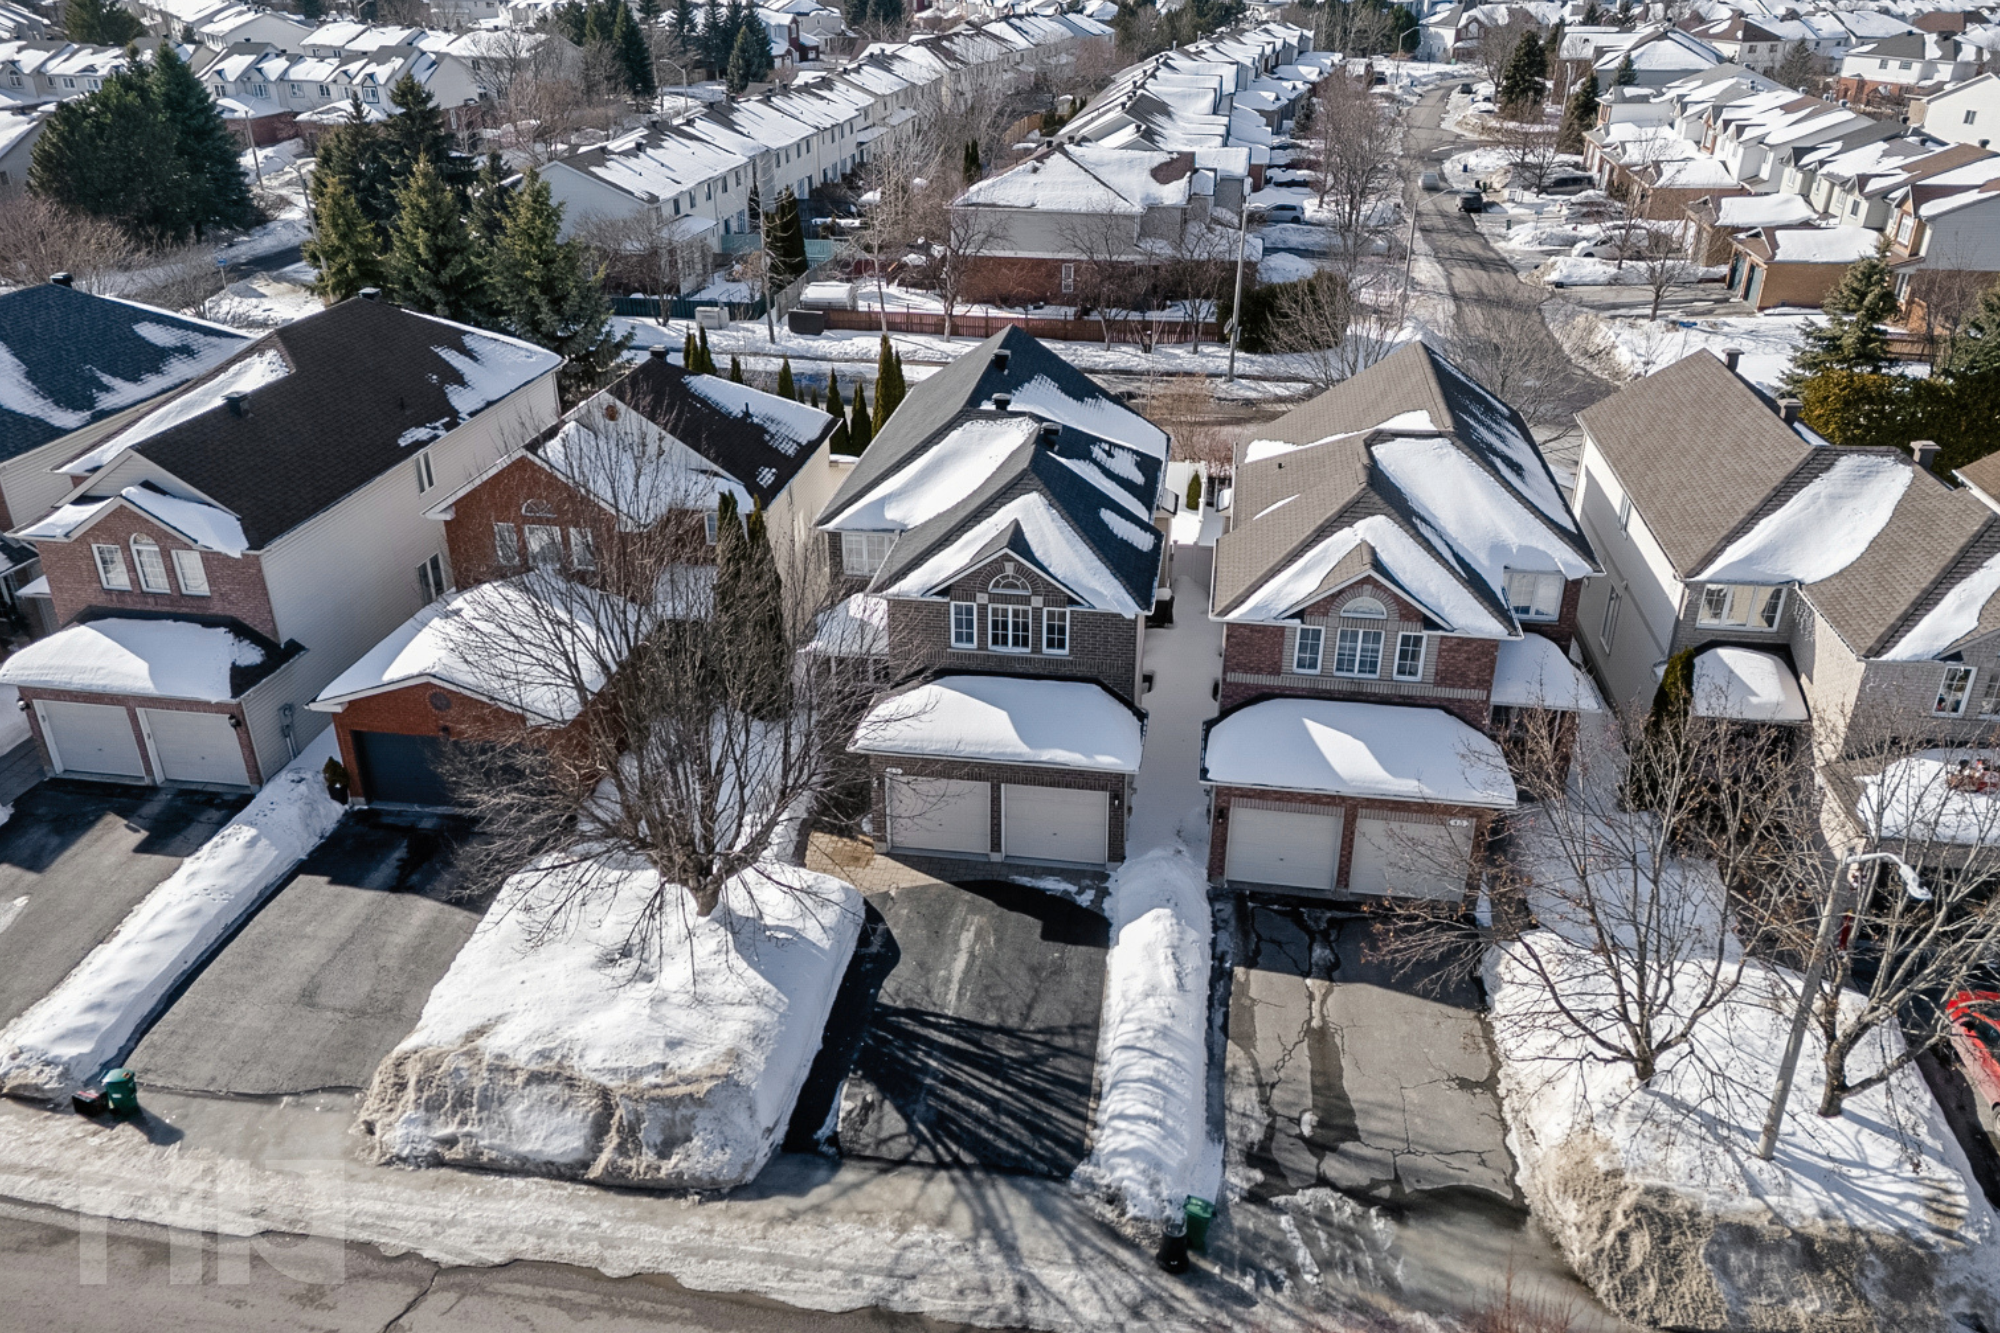
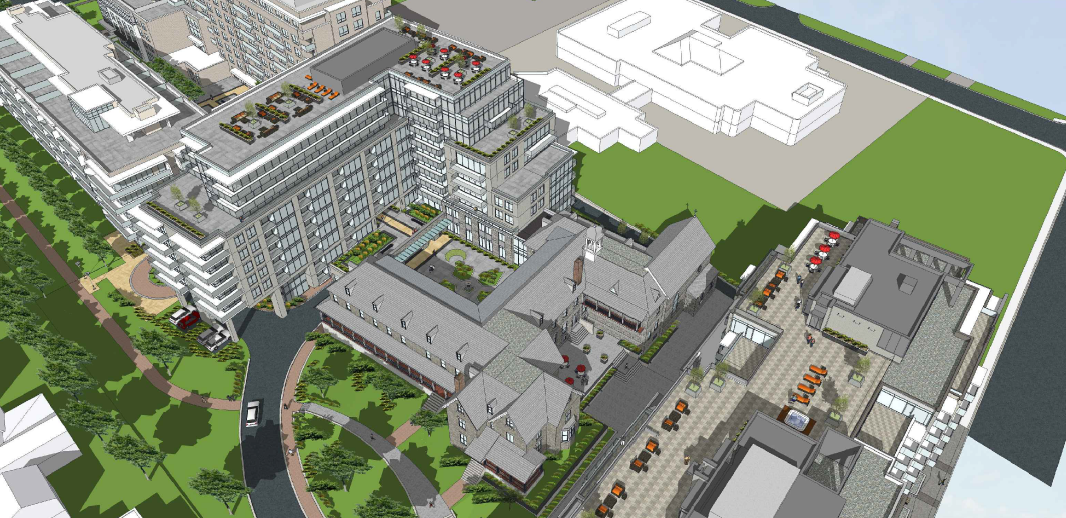
Ashcroft is gearing up to launch another condo tower at its successful Q-West project that is located on Richmond Road near Island Park. This project is not yet named, but is expected to be launched late October 2019 and once built will be attached the the convent as seen in the photo above. While pricing and floor plans have not officially been released, we are told that pricing is to be averaged out around $650/sqft. The building is set to have 150 units, over nine floors, with the bottom floors (40 units) being executive rentals. The 9th floor, and possibly 8th floor, will be a “mini-Monocle” with premium finishes and 10ft ceilings.

Ashcroft is looking to move quick and have an occupancy of late 2021.
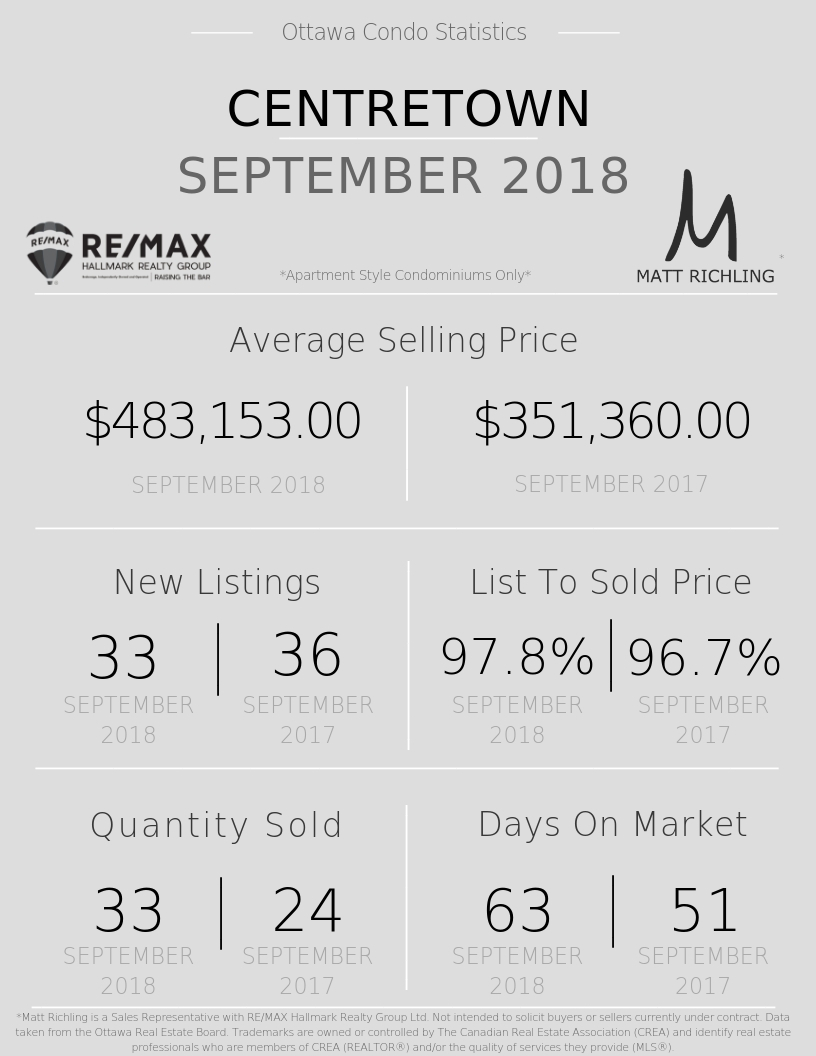
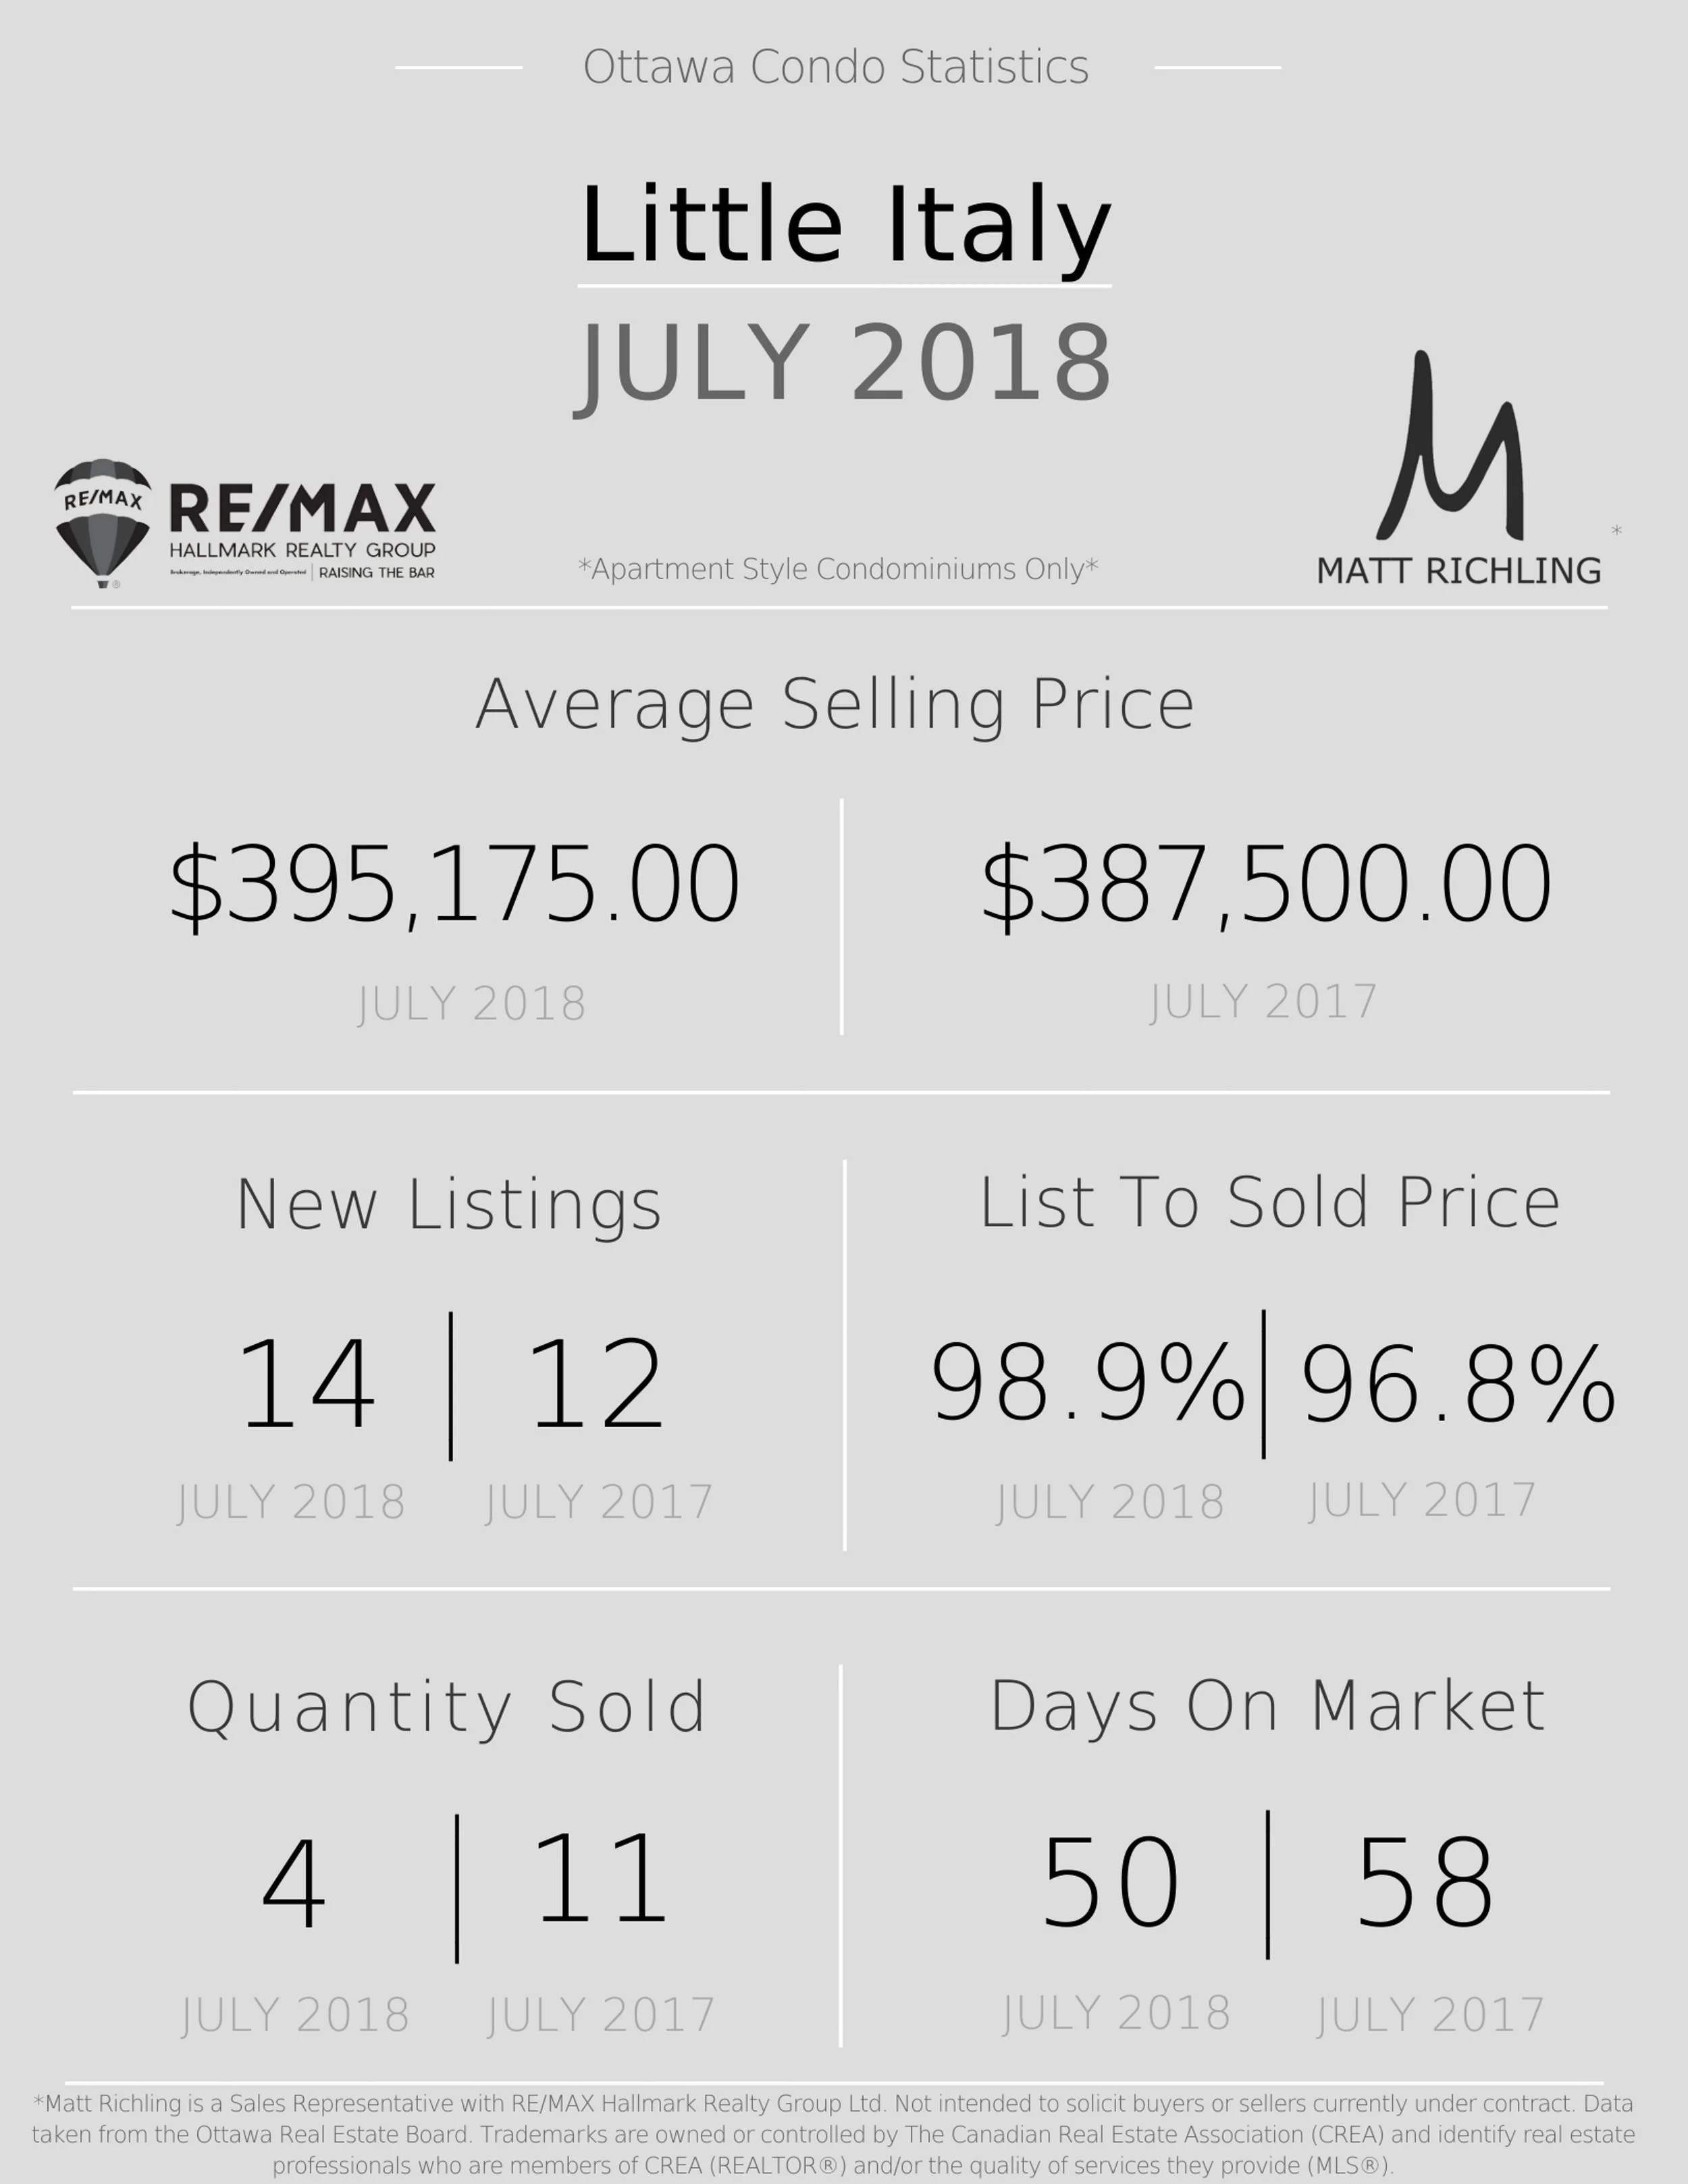
Fenced In Dog Parks And Where To Find Them In Ottawa

Adventure Awaits.jpg

If you are a dog owner and living in Centretown, Glebe, or Westboro, you are most likely wondering where the closest fenced dog park is located. Granted, you can take your pup for a walk in your neighbourhood but sometimes they just want to run and play! Fenced dog parks are essential when you want your dog to run off-leash but still have control of the environment they are in.

Centretown

There are two fenced in dog parks located in Centretown and their locations are convenient for those that either live towards Elgin St and Frank St or Slater St and Bronson Ave.

Jack Purcell Park is located on the corner of Frank and Elgin St, down the street from the Elgin St Diner. Jack Purcell Park has two gated entrances, the first gate allows you to prepare your dog to enter the dog park or if your dog needs a break there is a water fountain for you to use and a lower spout for your dog. The second gate allows you into the park where there is lots of room for your dog to play, as well as some shaded benches and able to relax at. The park is open 6am - 10pm year round and is closed 10pm-6am year round.

Tech Wall Dog Park is located on the corner of Slater St and Bronson Ave. This dog park has lots of room for your dog to run and play, there is a single gate access into the park and two benches at the entrance. The dog park is open year round from 5am-11pm.

Glebe

Lansdowne is well known for TD Place, Whole Foods, JOEY, and the Aberdeen Pavillion, but did you know just behind Lansdowne off Queen Elizabeth Dr is a dog park? This dog park has lots of room for your dog to run, roam, and play and several water fountains at your disposal. The dog park is open year round, 7 days a week.

Westboro

If you are driving west on the Queensway just after the Island Park off ramp is the Hampton Dog Run Park. You can access the dog park from Sebring Ave that leads into Parkview Rd. This large dog park is fenced in and is accessible 24 hours, 7 days a week.

Are there any others that we should add? Let us know.

Wading Pools 2019

2019 (1).jpg

Summer is fast approaching and what better way to spend some of the summer holiday than at a pool!

It’s not always easy to navigate where a wading pool is located, what time they are open, and what days they are closed. We narrowed down wading pools designated to four districts to help save time.

Centretown

St Lukes Park - 166 Frank St
Open: July 2nd - August 27th 2019.
Hours: Monday 11am-6pm, Tuesday 12pm-7pm, Thursday Noon - 7pm
Closed: Wednesdays and Fridays

McNabb Park - 435 Bronson Ave
Open: July 2nd - August 27th 2019.
Hours: Monday 11am-6pm, Tuesday 12pm - 6pm, Wednesday 12pm-7pm, Friday 11am - 6pm
Closed: Thursdays

Sandy Hill

Sandy Hill Park - 250 Somerset St
Open: July 2nd - August 27th, 2019.
Hours: Monday 11am - 6pm, Tuesday 12pm - 7pm, Wednesday 12pm - 7pm, Friday 11am - 6pm.
Closed: Thursdays

Strathcona Park - 25 Range Rd - Sandy Hill
Open: June 27th - August 27th 2019
Hours: Tuesday 12pm - 7pm, Wednesday 12pm -7pm, Thursday 12pm - 7pm, Friday 12pm - 6pm
Closed: Mondays

Untitled design.jpg

Little Italy

Chaudiere Park - 68 Elm St
Open: June 27th - August 27th 2019
Hours: Monday 11am-6pm, Tuesday 12pm - 7pm, Wednesday 12pm-7pm, Thursday 12pm - 7pm
Closed: Fridays

Hintonburg

Reid Park
Open: June 27 - August 27th 2019
Hours: Monday 11am - 6pm, Tuesday Closed, Wednesday 12pm -7pm, Thursday 12pm -7pm,
Closed: Fridays

Westboro

Lion’s Park - 294 Elmgrove Ave
Open: July 2nd - August 27th 2019
Hours: Monday 11am - 6pm, Tuesday 12pm - 7pm, Wednesday 12pm - 7pm, Thursday 12pm - 7pm, Friday 12pm - 7pm

Iona Park - 223 Iona St
Open: July 2nd - August 27th 2019
Hours: Tuesday 12pm - 7pm, Wednesday 12pm - 7pm, Thursday 12pm -7pm, Friday 12pm -6pm
Closed: Mondays

Hampton Park - 645 Parkview Rd
Open: June 27th  - August 27th 2019
Hours: Monday 11am - 6pm, Tuesday 12pm - 7pm, Wednesday 12pm - 7pm, Thursday 12pm - 7pm, Friday 11am - 6pm.


There are currently two staggered starting dates for wading pools to extend weeks of operation across Ottawa; June 27th - August 22nd 2019 and July 2nd - August 27th, 2019.

Ottawa Condo Market Statistics - September 2018

Ottawa-Condo-Stats-and-Data.jpg

Every month we take a closer look at the sales data for the previous month for the top five "downtown" area's - Centretown, Byward Market and Sandyhill, Little Italy (which includes Lebretown Flats), Hintonburg, and Westboro. The information will be specific to apartment style condominiums, and only what sold through the MLS. Also, DOM (Day's On Market) is calculated to include the conditional period which in Ottawa is almost every single transaction to be roughly 10-14 days. Questions?


CENTRETOWN

Market - Centretown.jpg

Huge jump in the average selling price for Centretown condos this year compared to September of 2017. Part of the reason for the large jump was due to a number of sales over the $500k mark. Over last month, we saw a similar number of new listings, while we saw quite a few more properties sell (33 vs 24). The list to sold price ratio stayed about the same, with the days on market increasing slightly (63 vs 51).


BYWARD MARKET AND SANDY HILL
(INCLUDES LOWERTOWN)

Market - Byward Market and Sandy Hill.jpg

Compared to last month, the Byward Market saw a healthy jump in average sold price with the number of sold condo units fell over last month (16 vs 24). Other than the differences in sold price, September of 2018 is pretty much the same as last year.


LITTLE ITALY
(INCLUDING LEBRETON FLATS)

Market - Little Italy.jpg

Little Italy continues to see fewer sales compared to new listings which is great if you are a buyer looking to enter. The average selling price is up over last month (362,330) and last year (329,086). Take the sold data with a grain of salt, since there is only a few sales to provide an average.


HINTONBURG

Market - Hintonburg.jpg

Hintonburg continues to be an area with healthy demand and very few options for buyers. Lots of older product with very few modern buildings that continue to cause havoc on the numbers. Like last month, we saw the same amount of new listings that ended up selling, providing no increase or decrease to number of available product. With that, the DOM and list to sold price continue to weaken. We are seeing first hand that nice product that is priced right will sell quick!


Westboro

Market - Westboro.jpg

Westboro continues to stay in great shape with one of the highest average selling prices. The DOM tightened up over last month, however we saw more activity which brought the other numbers more in line with what we are seeing across the city.


Looking for specific information about an Ottawa condo building or area? Thinking of buying and maximizing your dollar? Let's chat. Fill out the form below.

Ottawa Condo Market Statistics - August 2018

Ottawa-Condo-Stats-and-Data.jpg

We have taken a closer look at the sales data for the month of August 2018 for the top five "downtown" area's - Centretown, Byward Market and Sandyhill, Little Italy (which includes Lebretown Flats), Hintonburg, and Westboro. The information will be specific to apartment style condominiums, and only what sold through the MLS. Also, DOM (Day's On Market) is calculated to include the conditional period which in Ottawa is almost every single transaction to be roughly 10-14 days.


CENTRETOWN

Ottawa Condo Market Statistics Centretown

The market in Centretown slowed down over the month of August as most buyers and sellers are typically traveling or enjoying the summer before heading back to work. Compared to last month, (July 2018 stats) we saw our average selling price drop from $371,512 to $358,201, and only 32 new listings to July's 48. List to Sold prices came back to along what it was last year. 

What does this mean? While you could argue things slowed down, the lack of demand (fewer buyers) showed its head, and unless we see an increase in new listings in September, the DOM and list to sale price ratio will tighten up as there will be less to buy. We saw a more balanced market in August.


BYWARD MARKET AND SANDY HILL
(INCLUDES LOWERTOWN)

Market - Byward Market and Sandy Hill.jpg

Compared to July, we saw a $90,000 reduction in average sale price, fewer days on market, and a tighter list to sold price. In August we saw an equal amount of new listings to sold listings.

What does this mean? There was a higher demand for lower priced properties, and a strong pull from investors looking in that sub 300k market. The low amount of new listings, shorter days on market, and higher list to sold price ratio means things can easily jump in September unless we see more product come on the market. A sellers market below $300k, and a buyers market above $300k.


Little Italy
(INCLUDING LEBRETON FLATS)

Market - Little Italy.jpg

The seven sales in July were hot, which is evident in the 99.7% average list to sold price and the 35 average days on market. The average selling price dropped, which needs to be taken with a grain of salt since we have such low number of data points.

What does this mean? The properties that sold, were priced well and hot for the buyers looking. Its a buyers market, unless you are looking at one of the hot listings. Last month saw 14 new listings with only 4 sold. 


HINTONBURG

Market - Hintonburg.jpg

Looking at the differences over last year might give you a scare - however with such few data points, you need to understand it is not a perfect example and rather use trends to better understand the market. We saw more new listings and more sales this month than last month. The days on market stayed the same, and the average selling price dropped. Other than price, things have certainly improved over last year!

What does this mean? As with other areas, the amount of sales below the 300k continue to dominate. The market has certainly improved over last year, and I would be willing to bet that next month you will see the selling price jump back up. The lower DOM over last year still signifies that more buyers are looking here than before, and would be a good time to sell!


WESTBORO

Market - Westboro.jpg

Like last month, Westboro continues to be one of the hot markets with high prices and low inventory. A very tight List to Sold Price ratio and such few new listings makes this a unique market when you see the high DOM. The right properties are selling for close to ask, but taking longer. I would be willing to bet that September will see DOM drop.


Looking for specific information about a building or area? Thinking of buying and maximizing your dollar? Let's chat. Fill out the form below.

Ottawa Condo Market Statistics - July 2018

Ottawa-Condo-Stats-and-Data.jpg

Let's break down some specific data for the month of July for the top five "downtown" area's - specifically Centretown (including Golden Triangle), Byward Market and Sandyhill, Little Italy (which would include Lebreton Flats),  Hintonburg, and Westboro. The information will be specific to apartment style condominiums, and only what sold through the MLS. Also, DOM (Day's On Market) is calculated to include the conditional period which in Ottawa is almost every single transaction to be roughly 10-14 days.


Centretown

Ottawa Condo Market - Statistics Centretown.jpg

The market in Centretown continued to tighten for July which is noticeable in the higher list to sold price ratio of 99.1% compared to 98.8% (from last month) and the fewer days on market of 43 compared to 46 (from last month). We still have a similar amount of new listings as last month, however the amount of units that sold have dropped from 43 (June) to 29 (July). Prices are up compared to last year, however holding about the same as last month.

What does this mean? While things have tightened up, the numbers would show that there is going to be more units available going into August. This might ease up the DOM, Sold Price Ratio, or the average sold price - more supply with equal or less demand.... Could be seeing a shift to a more buyer focused market.


Byward Market and Sandy Hill
(Includes Lowertown)

Condo Market Statistics Ottawa - Byward Market and Sandy Hill.jpg

Compared to last month we have seen similar numbers except for two. The average price has jumped from $362,773 in June 2018, to $410,517 for July 2018. Keep in mind that in May 2018 it was almost $400k, so the large change is expected and due to the few number of data points that are used can vary the number. At the same time, the days on market has increased from 50 last month, to 84 this month. Note - the DOM hit 162 days back in January of 2016.

What does this mean? With the DOM jumping up to 84 days, yet amount of new and sold listings staying almost the same as last month, we would expect the price to come back down or the list to sold price ratio to drop. Still continues to be more of a buyers market, especially with the higher DOM, lower LTS price ratio, etc. 


Little Italy
(Including Lebreton Flats)

Market - Little Italy.jpg

Average price has jumped over last month (June 2018) to $395,175. However that is based on the only four sales that happened this month. We continue to see more new listings, and fewer sales. DOM has increased to 50 days and the LTSP ratio has nudged up to almost 98.9%. 

What does this mean? A buyers market. Higher DOM, more options (listings), etc. With only four sold it means you have less competition. However the high LTSP ratio says that for the sellers who are serious, and priced right, you can and will sell.


Hintonburg

Ottawa Condo Market - Hintonburg.jpg

The average sold price has dropped to $318,173, when it was $374,620 last month (June 2018). Activity has dropped (both new and sold listings), and the LTSP ratio edged up slightly. 

What does this mean? More of a sellers market. With fewer units available overall, a higher sold price ratio, and a somewhat low DOM, It would be a good time to sell. Buyers will want to see more supply, or need to be quick on their feet for the best units.


Westboro

Market - Westboro.jpg

The average price is up over last month, but down over this time last year. Less activity then last month, but similar ratio of new vs sold units. Same LTSP ratio as last month with DOM increasing slightly. 

What does this mean? Sellers market. Highest average price, and highest LTSP ratio, along with the similar ratio of new vs sold listings, make it a very difficult buyers market. Not much negotiating is going on. Chances of multiple offers are strong. Again, the higher price point is due mainly to the larger, longer planned living (compared to the studio and sub 600sqft units in Centretown etc.).


Looking for specific information about a building or area? Thinking of selling and want to get the best return? Let's chat. Fill out the form below.