Often, real estate is defined by its numbers and data - we can report on "hard facts" to provide a picture of the market. However, when we receive the standard monthly updates from the Ottawa Real Estate Board, I find it quite frustrating that the data reported for "condominiums" is board wide - meaning any property type that was listed as a condominium in any area. (This isn't a rant - there are too many micro markets across the city for them to report). What this means is that the information isn't compared by location (downtown vs Kanata) or property type (example - apartment or townhome) which can often mask or hide very interesting or specific information on a more detailed level. We all (should) know that there is a huge difference in price between a townhouse style condo in Kanata, versus a modern downtown highrise apartment in Centretown.
Let's break down some specific data for the top five "downtown" area's - specifically Centretown (including Golden Triangle), Byward Market and Sandyhill, Little Italy (which would include Lebreton Flats), Hintonburg, and Westboro. The information will be specific to apartment style condominiums, and only what sold through the MLS. Also, DOM (Day's On Market) is calculated to include the conditional period which in Ottawa is almost every single transaction to be roughly 10-14 days.
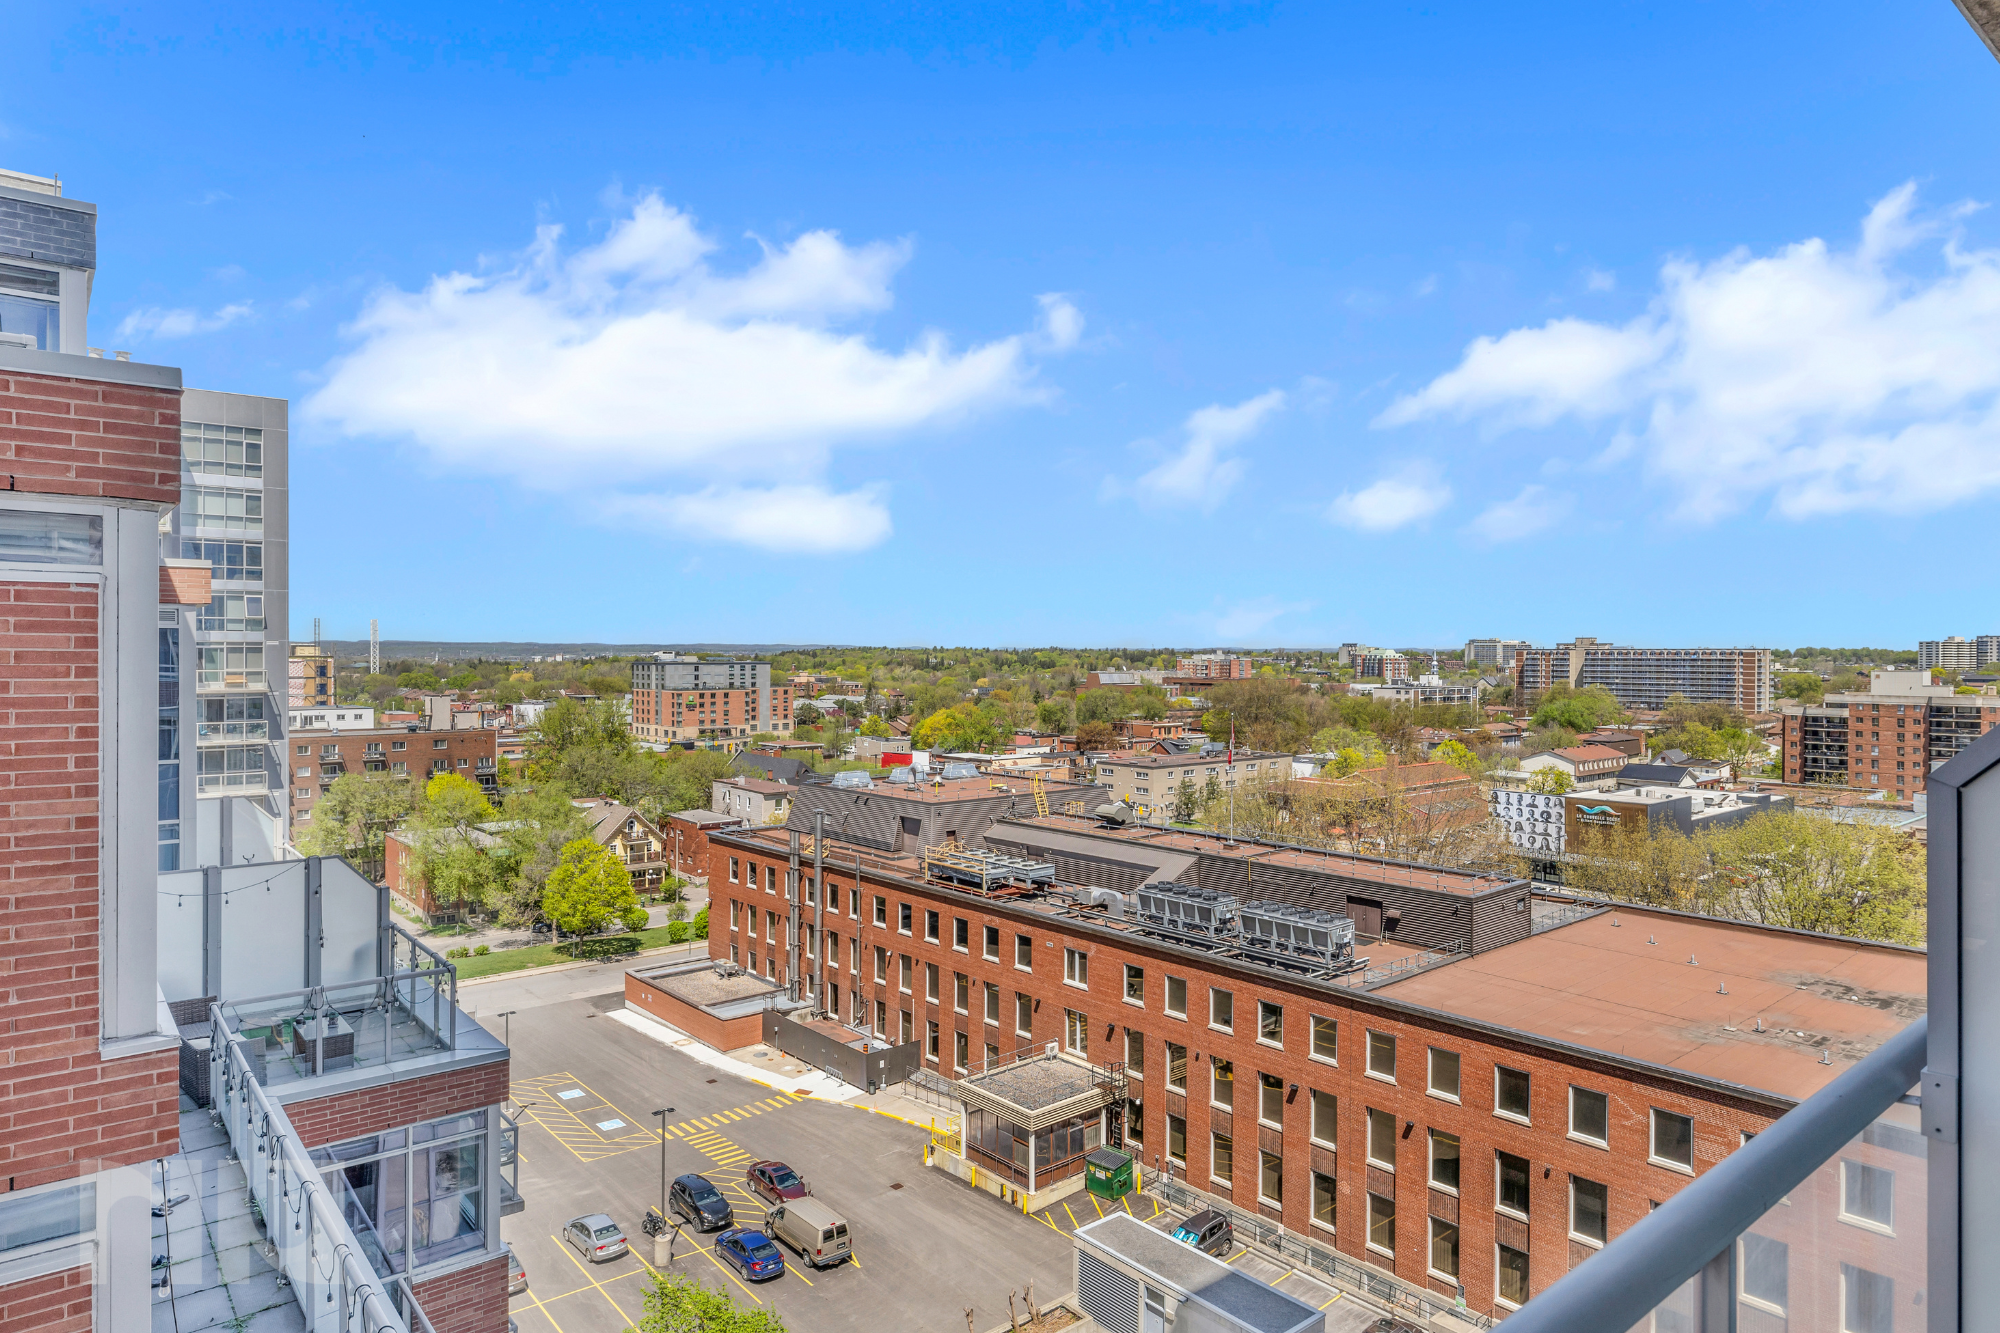
Centretown
(North of 417, Canal to the East, Bronson to the West, Parliament Hill to the North).
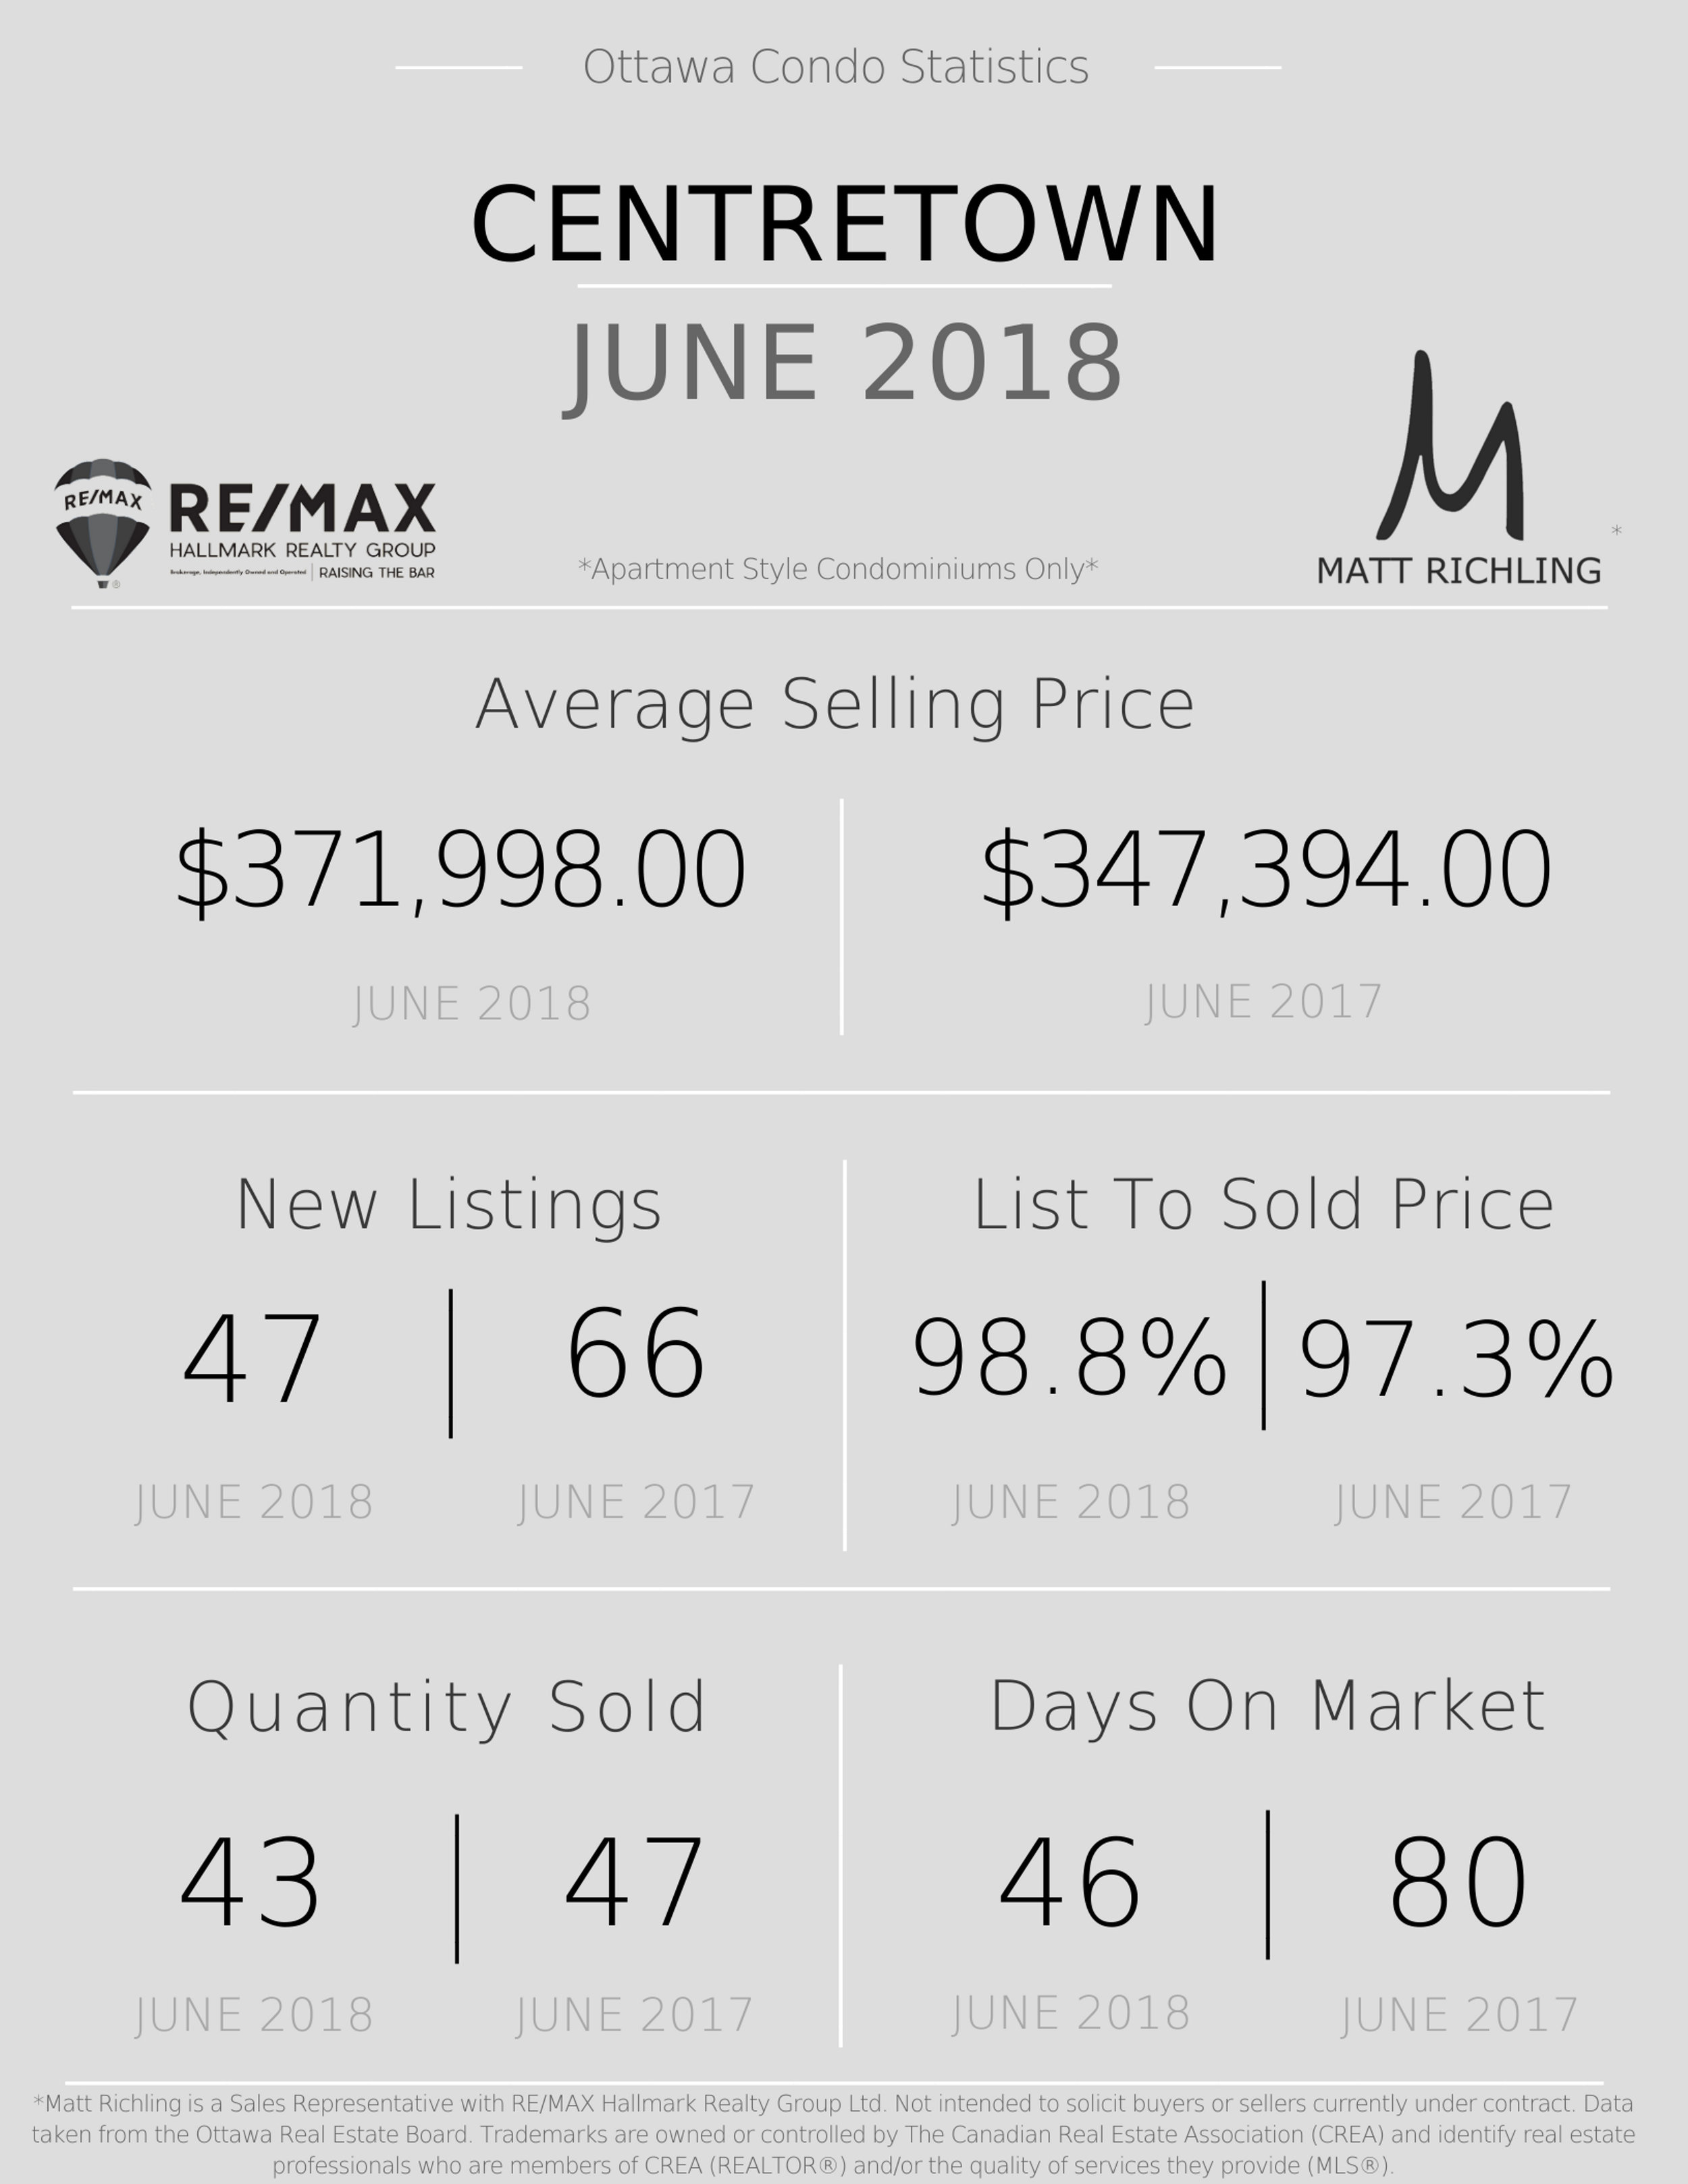
Overall the average sold price for a Centretown condo over the last month is $371,998.00 which is up compared to a year ago, which saw an average list price of $347,394.00. The average DOM is at 46 which is an improvement over last year at 80 days (Keep in mind that includes the conditional period). The list to sale price ratio has increased to just under 99%, and a nice increase over last year at just above 97%. In June, we saw only 47 new listings, with 43 sales.
What does it mean? A healthy increase in the demand for condos located in Centertown. A much more balanced market, with prices continuing to rise at a very marginal rate. One thing to note is that the DOM from two years ago was up to a whopping 85 days. Based on what was listed vs sold, I would expect the market to be more of a Seller's market unless we see more listings!
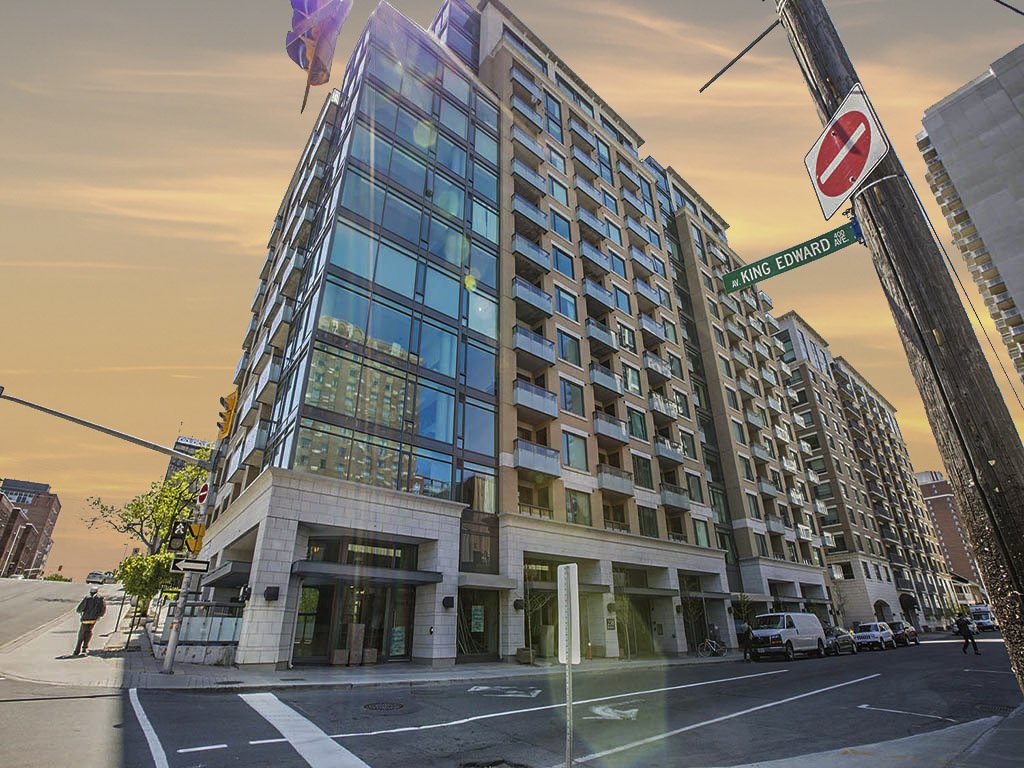
Byward Market and Sandy Hill
(Includes Lowertown)
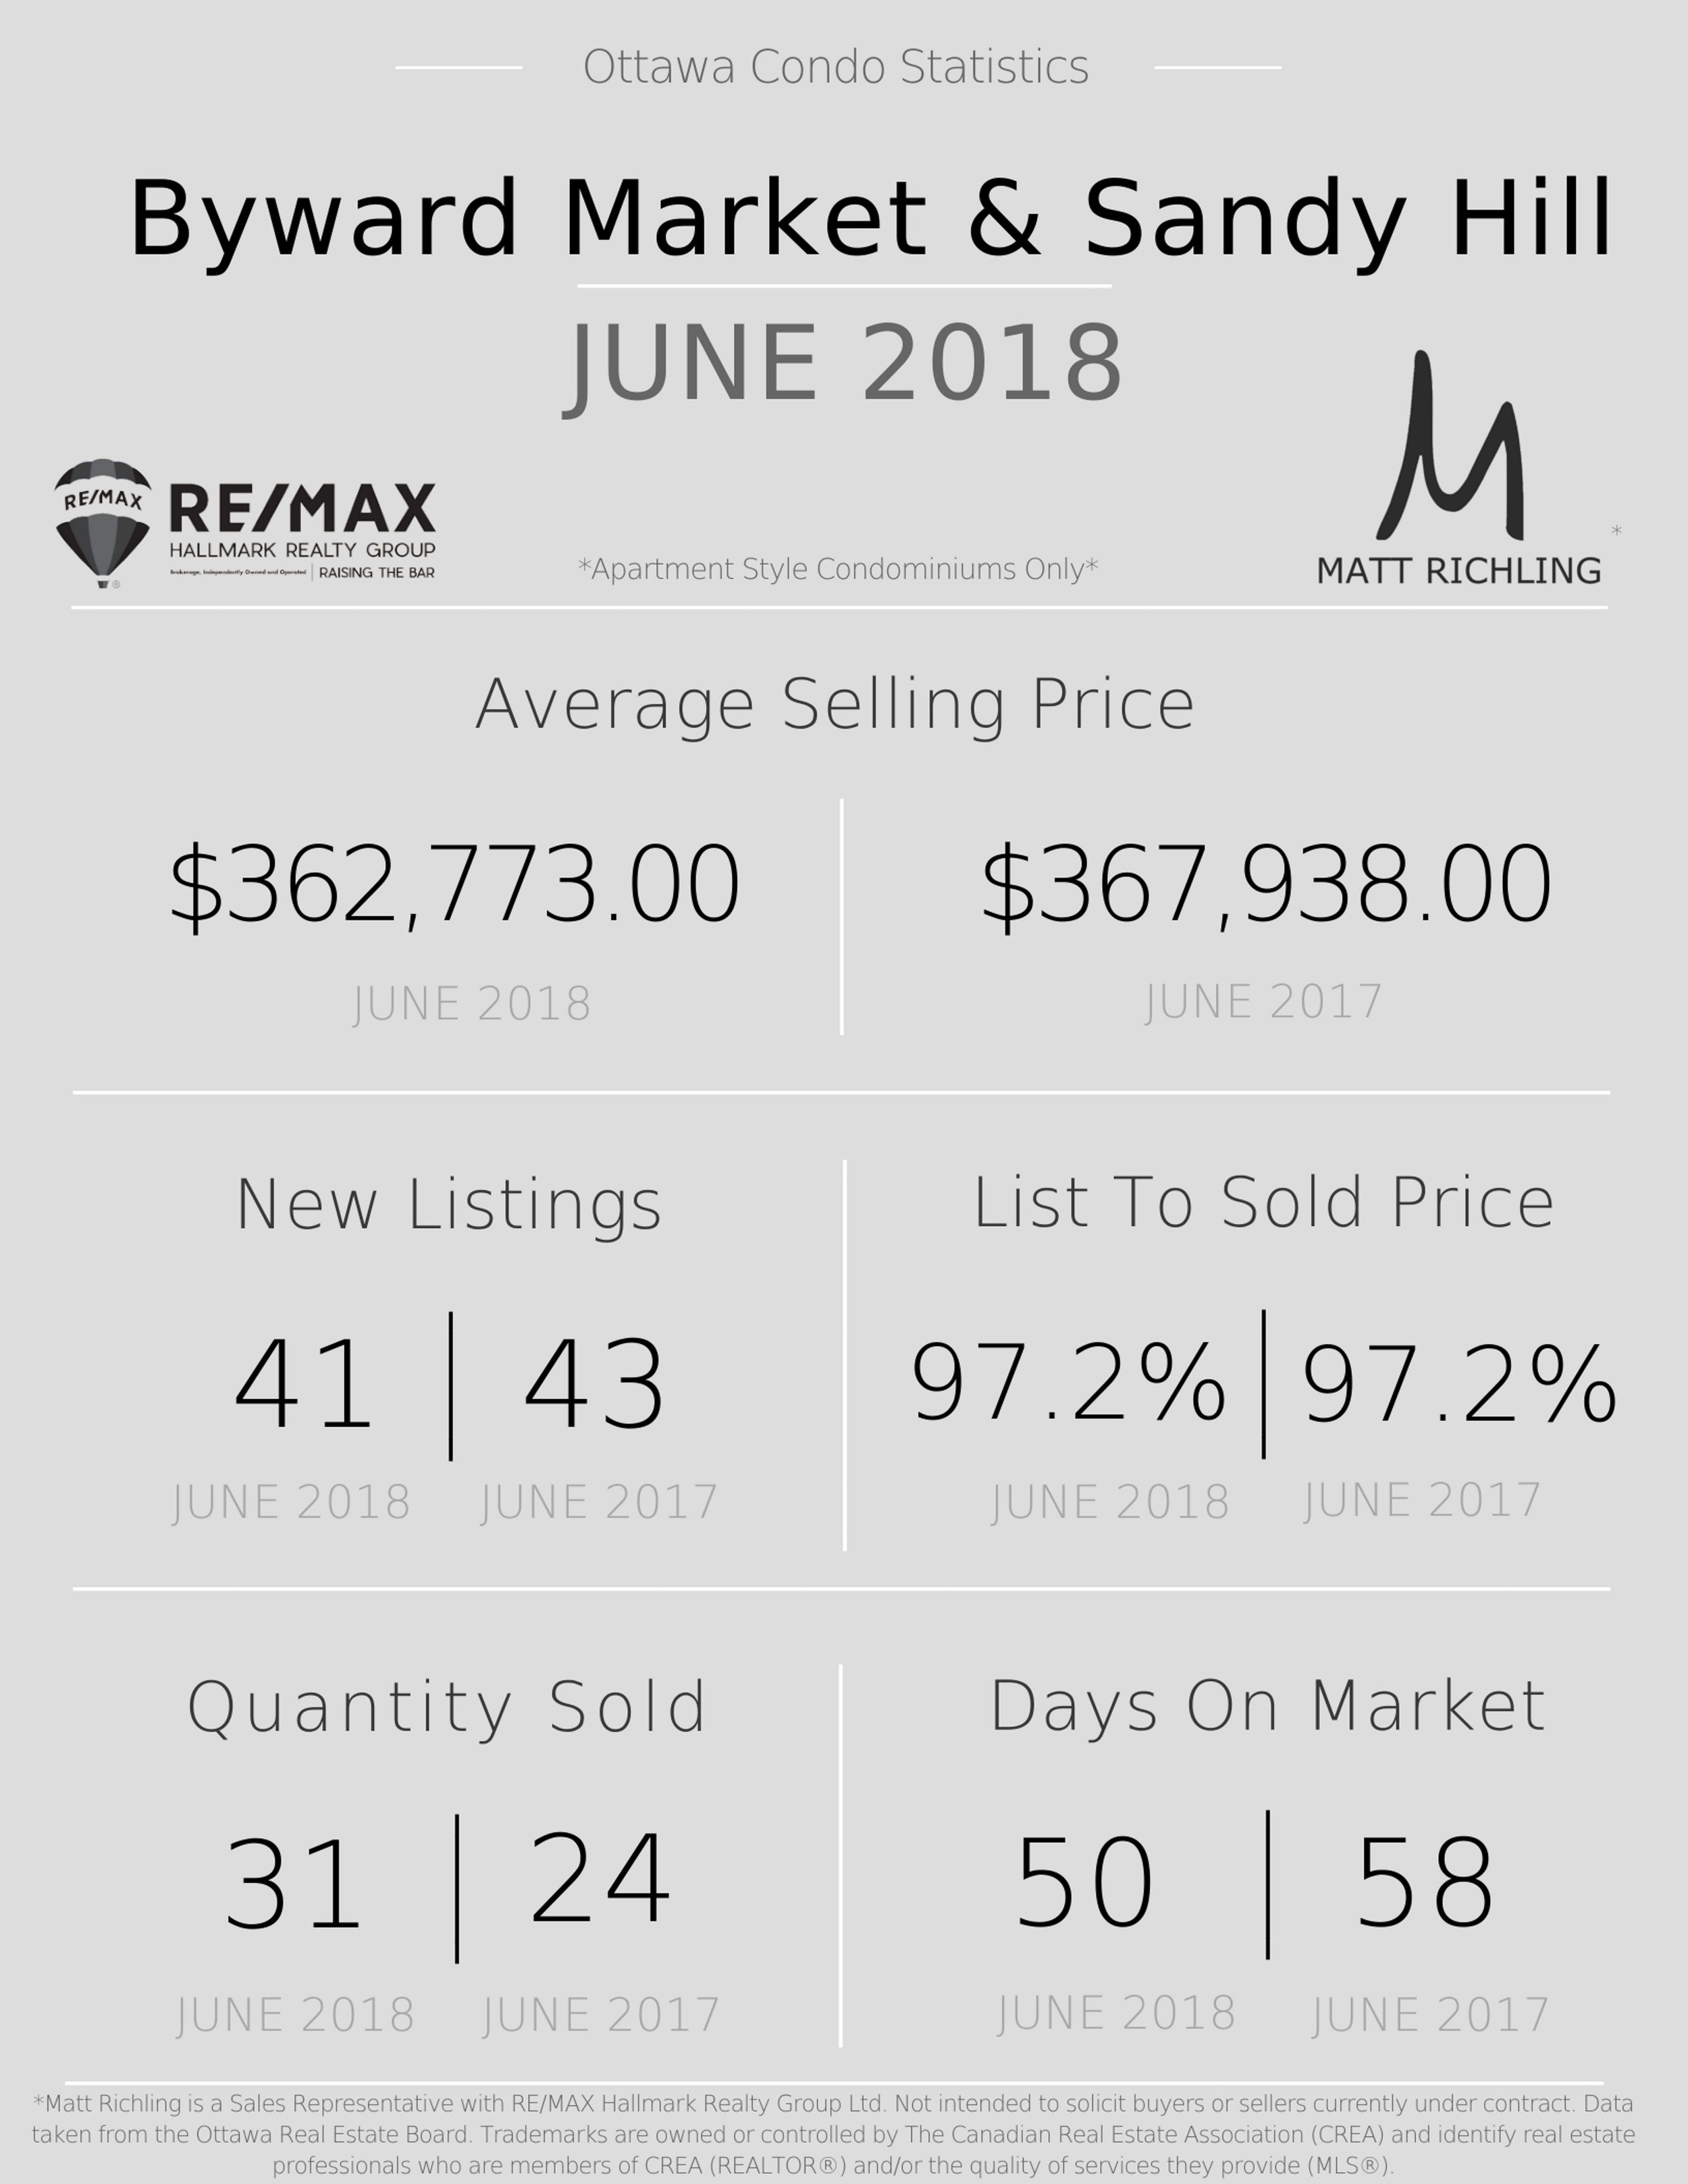
The average sold price this month in the Byward Market and Sandy Hill has dropped slightly to $362,773. The DOM has dropped to 50 days, and much better than it was 3 years ago - 75 days. The list to sale price ratio held the same around the low 97%.
What does this mean? Prices are lower and becoming more attractive to buyers which is helping to reduce the DOM. Slightly more leaning towards a buyers market then for selling. With the DOM lowering you should see the list to sale price ratio increase.
Little Italy
(Includes Lebreton Flats)
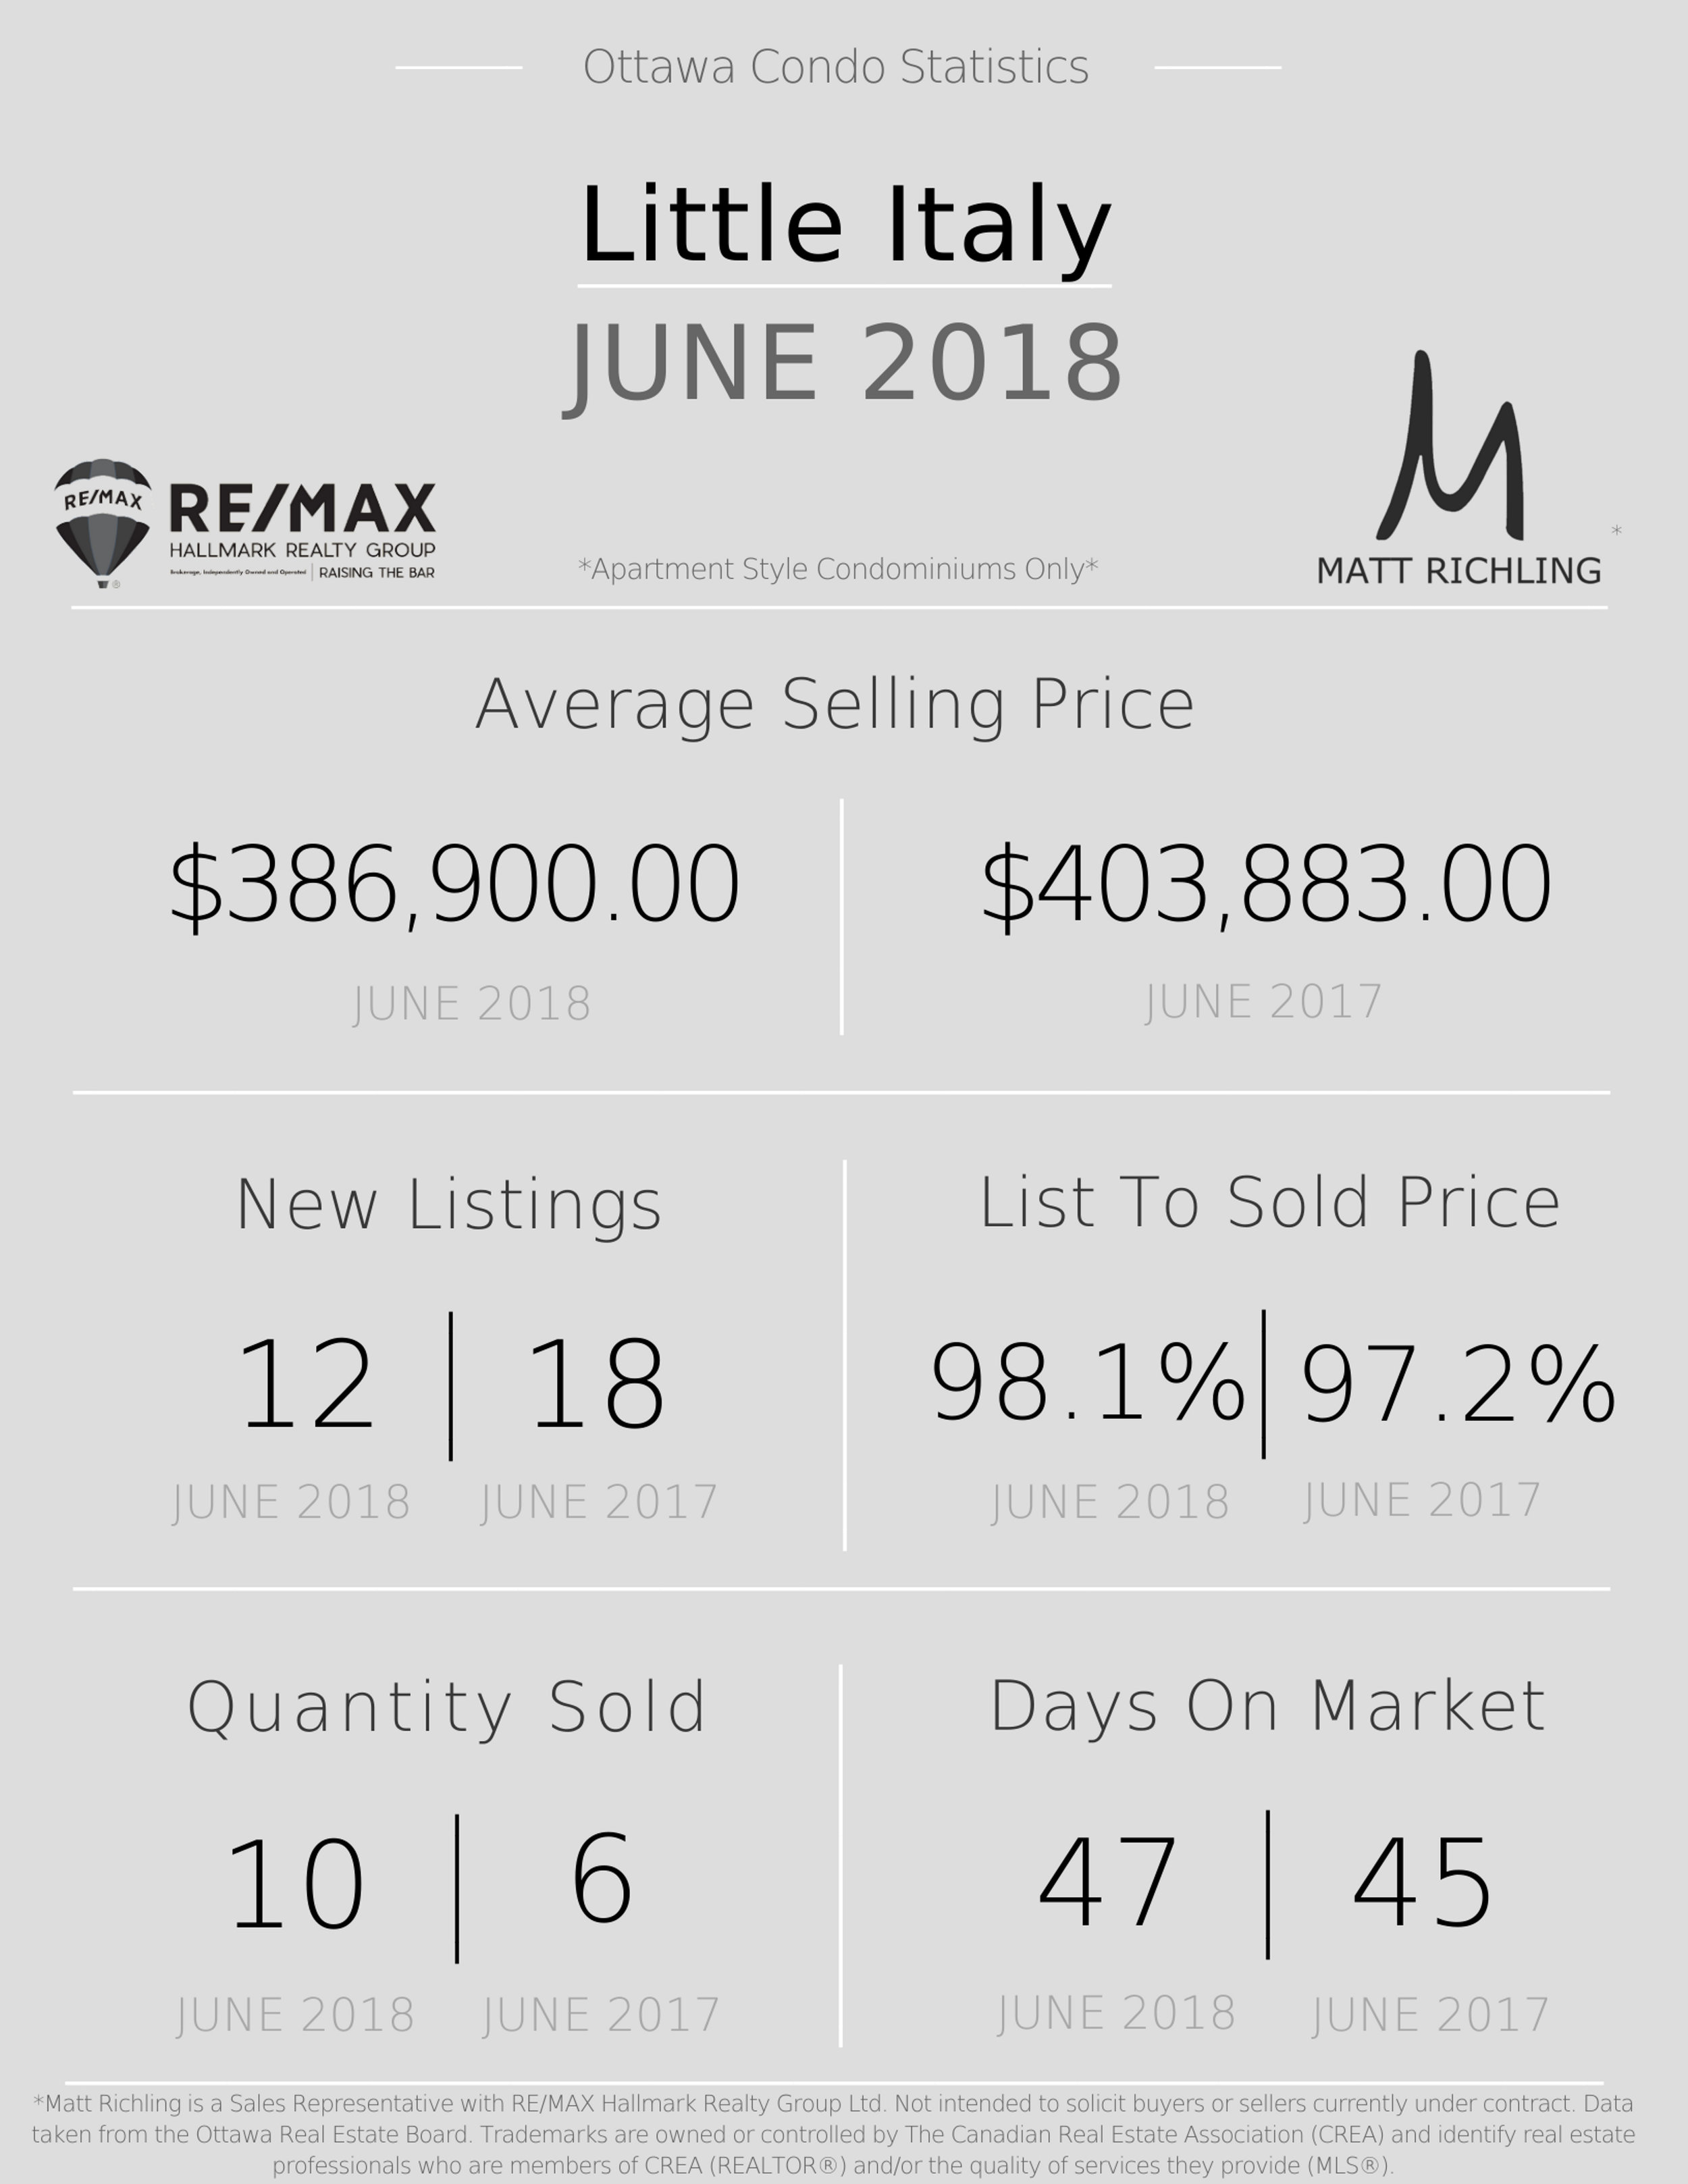
The average sold price for a condo in Little Italy is down to $386,900. The average DOM is up to 47 days, with the one year at 45 days. The average list to sold price ratio is up to 98.1%. Overall there are less new listings with a few more sales compared to last year.
What does this mean? Since there are fewer buildings which mean fewer sales, the numbers will be affected more by each sale. Lower prices will drive the DOM and sale price ratios as buyers compare them to other areas. The number of listings will increase, and as prices drop, the number of sales will increase. Great market if you are a buyer looking for options with less competition.
Hintonburg

The average sold price in Hintonburg lowered slightly from last year, to $374,620. More sales and a much tighter list to sold price ratio have dropped the DOM to less than half - now 39 days from the 89 days a year ago.
What does this mean? It is much more of a seller's market than a buyer's market. I think it will get tighter unless we see more listings. More buyers looking to move more west! It is a great time to sell.
Westboro
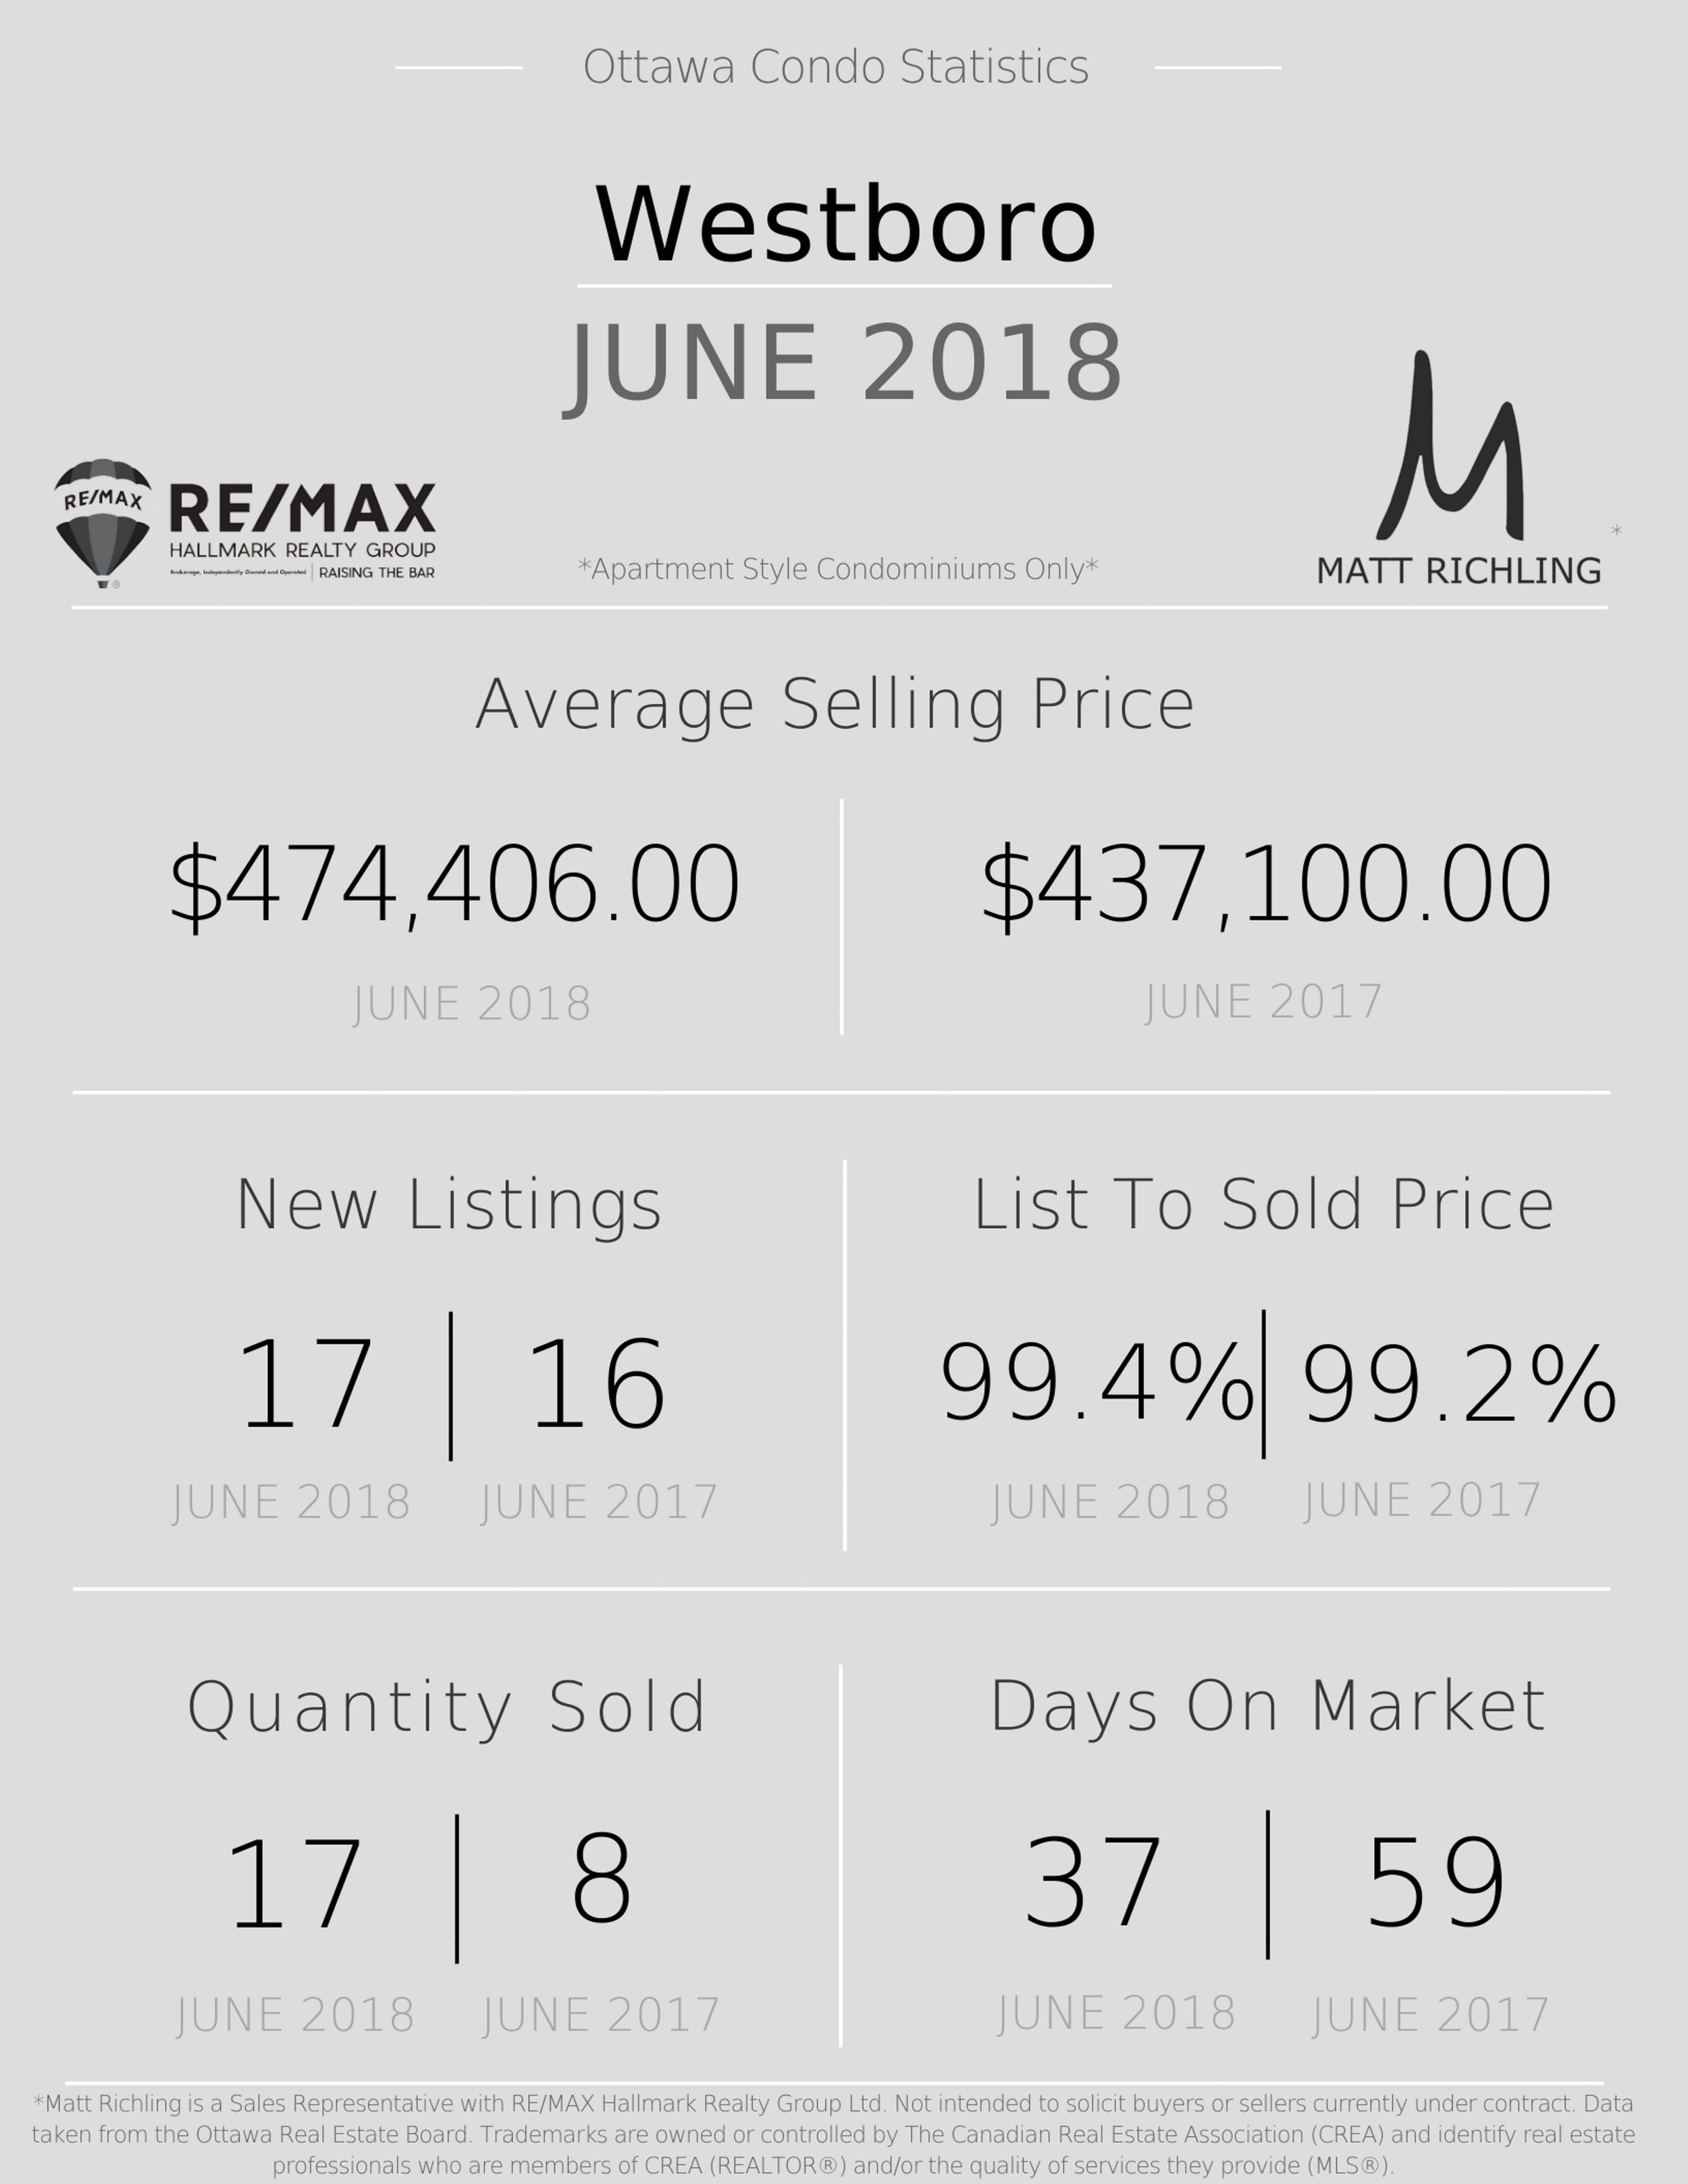
The average sale price in Westboro is up from last year to $474,406. With 17 new listings and 17 sold properties. The highest list to sold price ratio in any of the five area's at 99.4%! The DOM is also quite low at 37!
What does this mean? A hard market if you are a buyer. Considering that almost all condos will sell with a conditional period for status certificate review of 10-14 days, the DOM of 37 is very good for sellers. The higher price point is due mainly to larger, longer term planned living (compared to studio's and sub 600sqft units found more in Centretown and Byward Market).
Are you looking for more information about a specific area or building? Thinking of selling or buying? Let's chat - click on the button below!